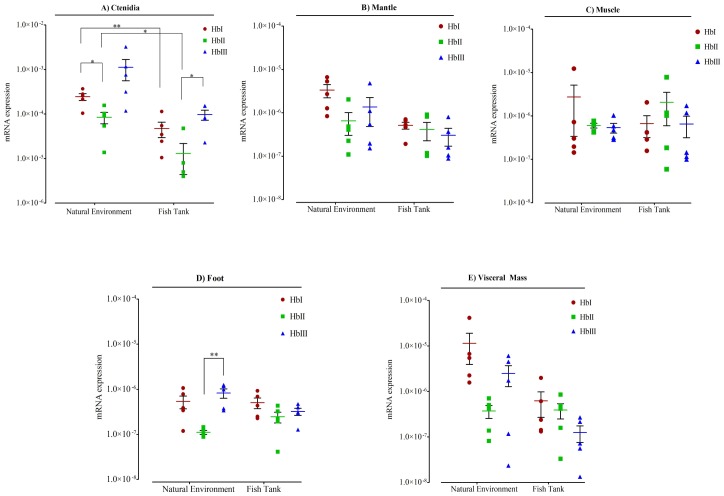
Fig 7. Relative quantitation of mRNAs of Lucina pectinata’s Hbs in all tissues examined for both conditions.
Data is represented as aligned dot plot using logarithmic scale, showing mean (horizontal bars) and SEM (whiskers). One group was harvested in their sulfide-rich mud natural environment (labeled on X axis as Natural environment) and another group of clams were kept in a fish tank in fresh sea water (labeled on X axis as Fish Tank). Significant differences are indicated with an asterisk at p < 0.05, and with two asterisks at p < 0.01. Gene expression analysis at the mRNA level of L. pectinata hemoglobins (Hbs) was measured using Real Time RT-PCR. A) Hbs expression in ctenidia tissue; B) Hbs expression in mantle tissue; C) Hbs expression in muscle tissue; D) Hbs expression in foot tissue; E) Hbs expression in visceral mass tissue.

