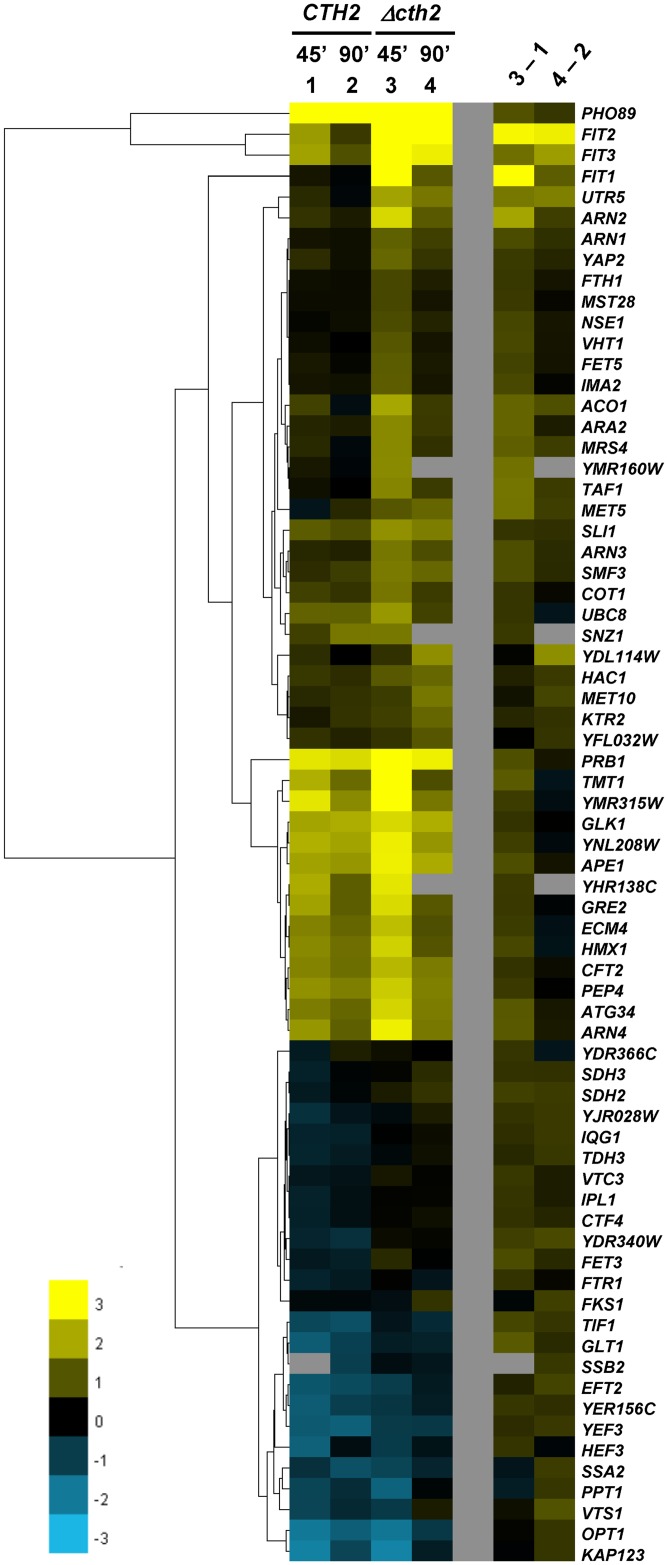
Fig 1. Set of genes upregulated in the absence of CTH2 under oxidative stress conditions.
The heat map shows the relative expression levels upon 0.1 mM t-BOOH treatment (ratio time 45 min or 90 min vs time 0) of the 70 genes that showed upregulated expression in the Δcth2 mutant (MML1081) as compared to the strain expressing CTH2 (MML1082). To identify patterns of expression we performed cluster analysis with a hierarchical method implemented in the cluster 3.0 software. The tree obtained with this method is shown on the left of the heat map. Three distinct patterns are observed (see text). The differential expression between the Δcth2 and the CTH2 strains (3–1 and 4–2) is also shown. Data depicted are log2 values and are the median for three or four microarrays. Upregulation is shown in yellow; downregulation in blue. Raw experimental data are deposited at ArrayExpress database, with accession number E-MTAB-4122.

