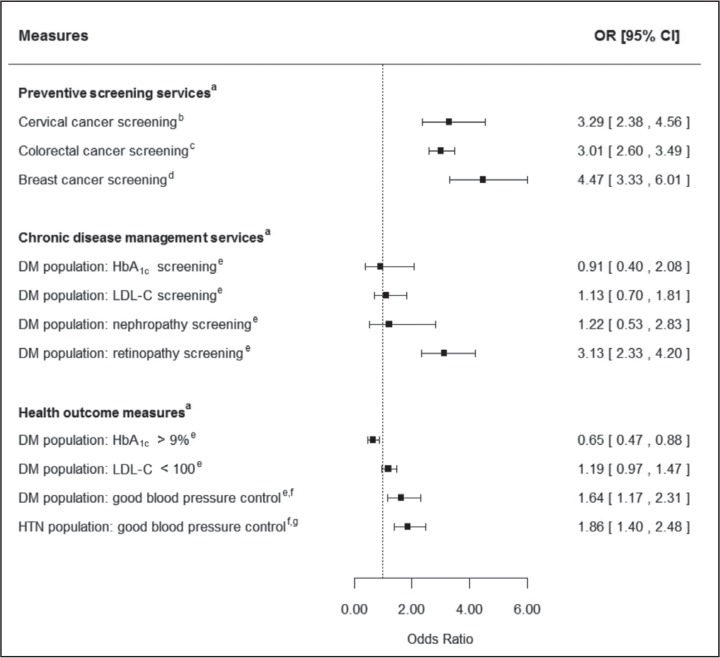
Figure 2.
Multivariate logistic regression results: dental group vs nondental group.
aHealthcare Effectiveness Data and Information Set metrics assessed between September 1, 2013, and August 31, 2014.
bCervical cancer screening model adjusted for body mass index ≥ 30 kg/m2 vs < 30 kg/m2 (reference group).
cColorectal cancer screening model adjusted for age (continuous) and race (white vs nonwhite [reference group]).
dBreast cancer screening model adjusted for race (white vs nonwhite [reference group]).
eDiabetes mellitus (DM) population models adjusted for age.
fGood blood pressure control was defined as systolic value < 140 mmHg and diastolic value < 90 mmHg.
gHypertension (HTN) population model adjusted for body mass index ≥ 30 kg/m2 vs < 30 kg/m2 (reference group) and primary care utilization (2-plus visits vs 1 visit [reference group]).
CI = confidence interval; HbA1c = hemoglobin A1c; LDL-C = low-density lipoprotein cholesterol (mg/dL); OR = odds ratio.

