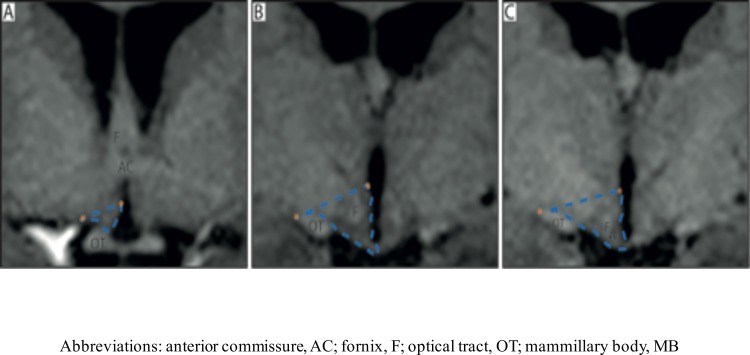
Fig 1. Overview of the delineation of the HT.
Overview of the boundaries used to delineate the HT in T1-weighted MRI acquired at 3T according to the procedure established by Gabery et al., 2014 [17]. A-C represent the hypothalamic region in a coronal plane from rostral to caudal direction. The blue dashed lines illustrate how the hypothalamic region was delineated. Landmarks such as the hypothalamic sulcus and the lateral or medial edge of the optical tract represented by orange stars were identified for the delineation. A straight line between these two points was drawn to set the superior/lateral border of the area. The optical tract was excluded in all slides.

