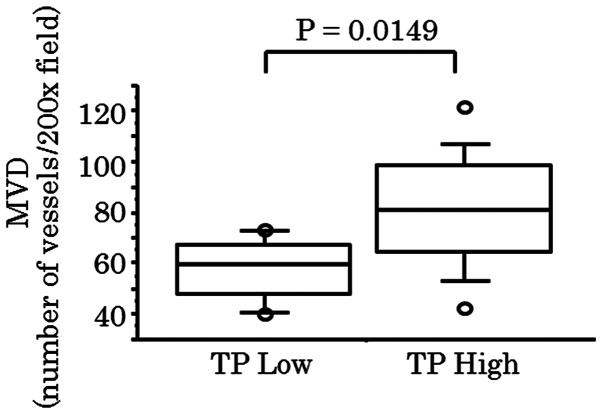
Figure 4.
MVD in the high and low TP expression groups of Dukes' stage D. The mean MVD in the high TP expression group was significantly higher than that of the low TP expression group (P=0.0149). The data are expressed as the mean±standard deviation. MVD, microvessel density; TP, thymidine phosphorylase.

