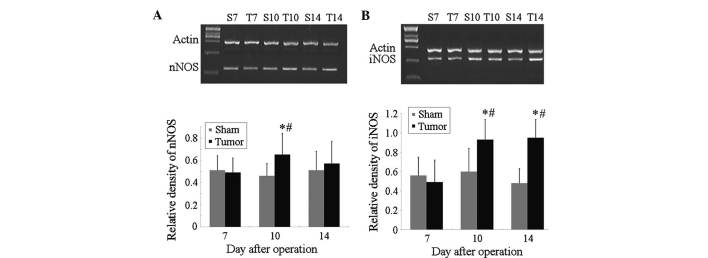
Figure 2.
mRNA levels of (A) nNOS and (B) iNOS determined by reverse-transcription quantitative polymerase chain reaction with β-actin used as an internal standard. The mRNA levels of nNOS and iNOS were significantly increased at post-operative day 10 when compared with those of the controls. The increase of iNOS continued until post-operative day 14, while that of nNOS did not. Values are expressed as the mean ± standard deviation. *P<0.05 vs. sham group at the same time-point, #P<0.05 vs. the same group of mice at day 7. iNOS, inducible nitric oxide synthase; nNOS, neuronal NOS; S, sham; T, tumor.

