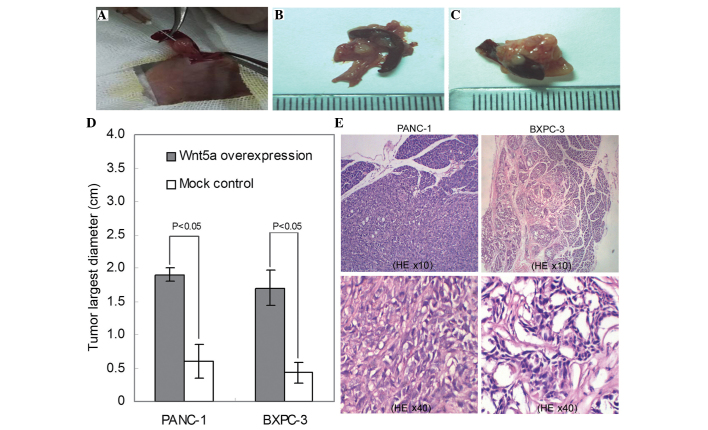
Figure 4.
Wnt5a induces tumor growth in an orthotopic mouse model of pancreatic cancer cells. (A) Image of dissected pancreatic tissue from the mouse model and injection of pancreatic cancer cells into the pancreatic parenchyma. (B) Representative images of the implantation of tumor tissues in the Wnt5a-overexpressed PANC-1cells. (C) Representative images of implantation of tumor tissues of the control cells. (D) Bar graph shows the average diameters of the orthotopic tumors in each condition. Results are expressed as the mean ± standard deviation. (E) HE staining. Representative micrographs show tumor morphology in the tumor tissues of the BXPC-3 and PCNA-1 cells. HE, hematoxylin and eosin.

