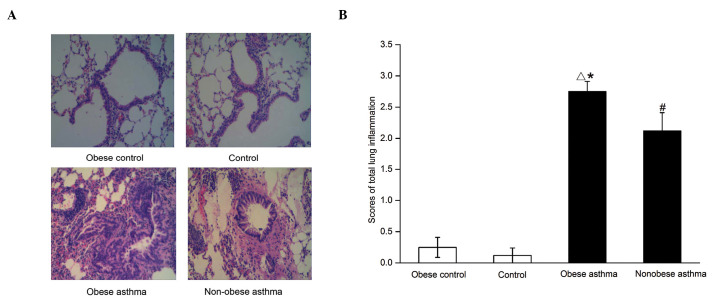
Figure 1.
Pathological analyses of the pulmonary tissues from mice in the control and experimental groups. (A) Hematoxylin and eosin staining images are shown (magnification, ×200). A marked infiltration of inflammatory cells was observed in the obese asthmatic animals. (B) Summary of the scores in lung inflammation. The scores were assigned as follows: 0, no inflammation; 1, occasional inflammatory cells; 2, bronchi or vessels surrounded by folium (1–5 cells) of inflammatory cells; 3, thick layer of inflammatory cells (>5 cells) surrounding the bronchi or vessels. Data are presented as the mean ± standard error of the mean. △P<0.01, obese asthma vs. obese control and control; #P<0.01, non-obese asthma vs. obese control and control; *P<0.05, obese asthma vs. non-obese asthma.

