
Figure 3.
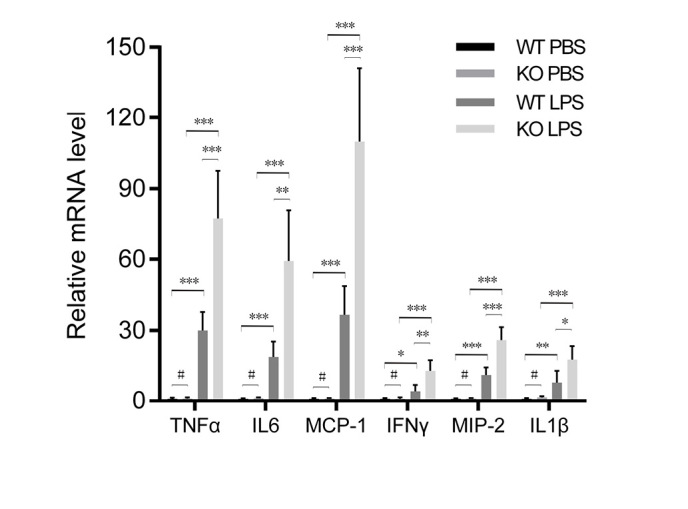
Quantified mRNA expression of proinflammatory cytokines and chemokines is higher in KO compared with WT mice following LPS or PBS treatment. Data are presented as mean value ± standard deviation. #P>0.05, *P<0.05, **P<0.01, ***P<0.001 (n=6). WT, wild-type; PBS, phosphate-buffered saline; KO, knockout; LPS, lipopolysaccharides; TNF-α, tumor necrosis factor-α; IL-6, interleukin-6; MCP-1, monocyte chemotactic protein-1; IFNγ, interferon γ; MIP-2, macrophage inflammatory protein-2; IL-1β, interleukin-1β.