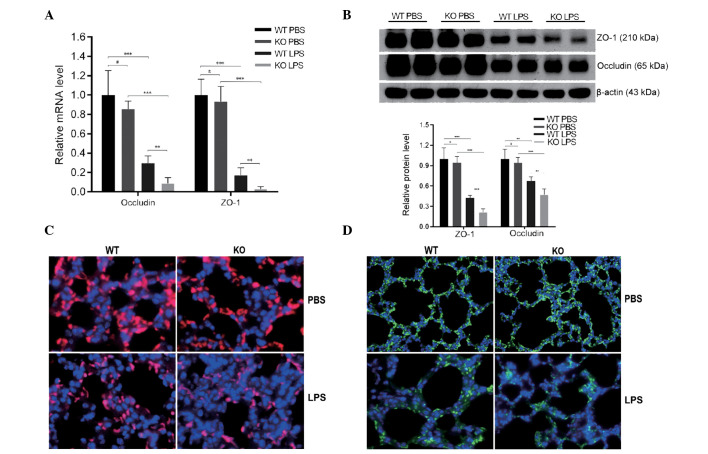
Figure 4.
KO mice exhibit reduced occludin and ZO-1 expression following LPS treatment. (A) Quantification of occludin and ZO-1 mRNA expression in WT and KO mice following LPS or PBS treatment. (B) Western blots and quantification of ZO-1 and occludin protein levels in lung lysates. (C) Occludin (red, occludin and Alexa Fluor 488; blue, DAPI) and (D) ZO-1 (blue, DAPI; green, ZO-1 and Alexa Fluor 488) immunofluorescence staining. Data are presented as the mean ± standard deviation #P>0.05, **P<0.01, ***P<0.001 (n=5–6 per group). WT, wild-type; PBS, phosphate-buffered saline; KO, knockout; LPS, lipopolysaccharides; ZO-1, zonula occludens-1.

