
Figure 5.
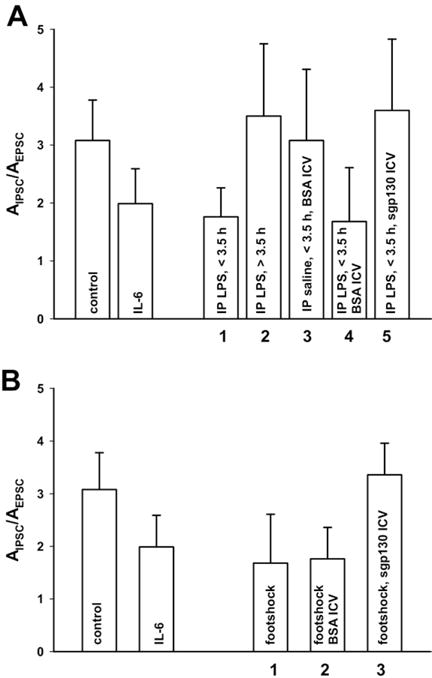
Effect of stress on synaptic inhibition/excitation ratio (SIER). (A) Bar graph displaying SIER after IP injections of lipopolysaccharide (LPS) or saline: the first two bars, shown for comparison, represent SIER in control and after bath-application of IL-6. Bars 1 and 2 represent the effect of IP injection of LPS <3.5 hours after injection or >3.5 hours after the injection, respectively. Bar 3 shows the effect of IP saline and bovine serum albumin (BSA) intracerebro-ventricularly (ICV) (<3.5 hours after injection). Bar 4 shows the effect of IP LPS and BSAICV(<3.5hours). Bar 5 represents the effect of IP LPS and soluble sgp130Fc ICV (<3.5 hours). (B) First two bars, as in preceding. Bar 1 represents the effect of FS on SIER. Bar 2 and 3 represent the effect of FS preceded by BSA or soluble sgp130Fc ICV, respectively. Abbreviations as in Figure 1.