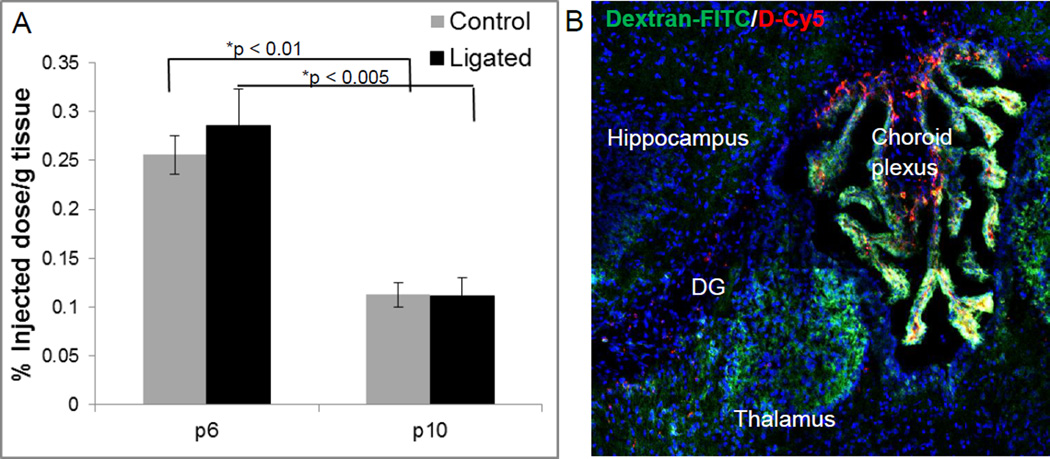
Figure 3. Quantification of dendrimer-Cy5 uptake in the brain of ligated and control pups at P6 and P10.
(A) Dendrimer-Cy5 uptake was quantified 24 hours after systemic administration using HPLC. Data is expressed as a percentage of injected dose (ID) of D-Cy5 in the ligated hemisphere per gram of tissue, with n = 5 pups per group per timepoint. Dendrimer uptake was highest in the ligated hemisphere of ligated mice at P6. *represents statistically significant (p < 0.05) data. (B) BBB impairment in thalamic nuclei and dentate gyrus near the third ventricle in P6 healthy control mice as indicated by dextran-FITC (40kDa, green) extravasation. D-Cy5 (red) accumulation is present in these regions, as well as in the choroid plexus.

