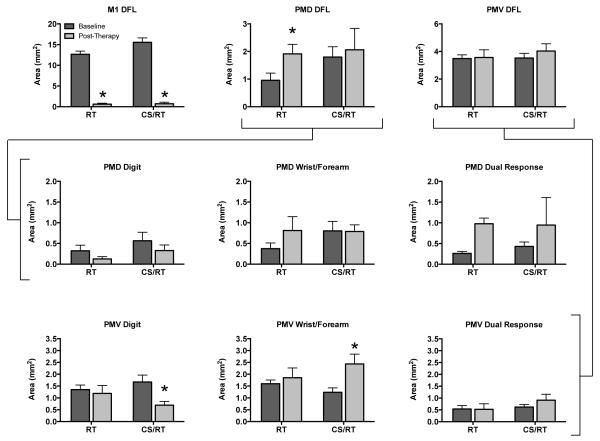
Figure 4.
Area of distal forelimb (DFL) representations in M1, PMD, and PMV prior to infarct (“baseline”, dark gray) and after RT or CS/RT treatment (“post-therapy”, light gray). Top row. In M1, the ischemic infarct produced a significant and equivalent reduction in DFL area in both groups (p<0.001, left graph). PMD DFL area significantly increased in the RT group (p<0.029) but not in the CS/RT group (middle graph). There were no changes in total DFL area in PMV for either group (right graph). There were no between group differences in baseline area in PMD or PMV for any of the data shown in this figure (all 9 graphs). Middle row. Comparison of three movement types evoked by ICMS in PMD. There were no significant within-group differences in digit (left graph), wrist/forearm (middle graph), or dual-response (right graph) representations in PMD. The increase in overall DFL area in the RT group (top row) was driven by the separate non-significant increases in wrist/forearm and dual-response representations (69% of these dual-responses included wrist/forearm movements). Bottom row. Comparison of three movement types evoked by ICMS in PMV. There was a significant decrease in digit area (p<0.009, left graph) and a significant increase in wrist/forearm area (p<0.021, middle graph) for the CS/RT group in PMV. These changes offset each other in the overall size of the PMV DFL map in this group (top row). There were no significant changes in the RT group in PMV.

