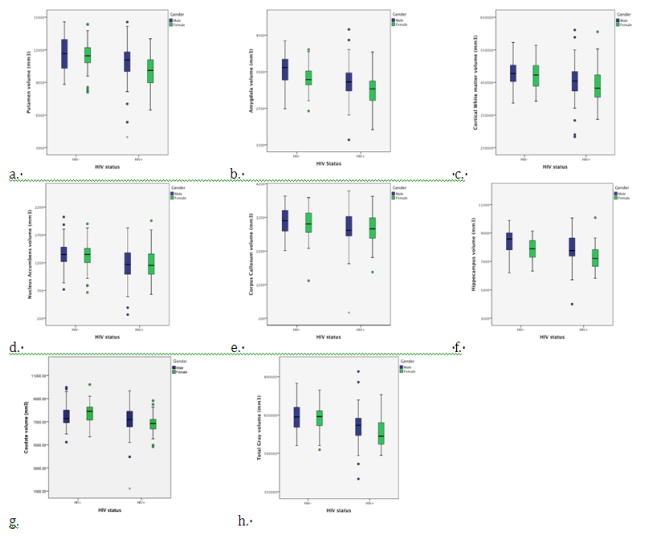
Figure 1.
Boxplots of the volumes (mm3) for HIV infected (HIV+) and HIV uninfected (HIV−) groups. Lines within each box represent the mean values for volumes of each group and bars represent standard deviation within each of the following regions: a. Putamen, b: Amygdala, c. White Matter, d. Nucleus Accumbens, e. Corpus Callosum, f. Hippocampus, g. Caudate, h. Total Gray Matter.
The effect of HIV on the Corpus Callosum does not survive false discovery rate (FDR) correction. However, for all other regions the effect of HIV but not gender was significant after FDR correction.

