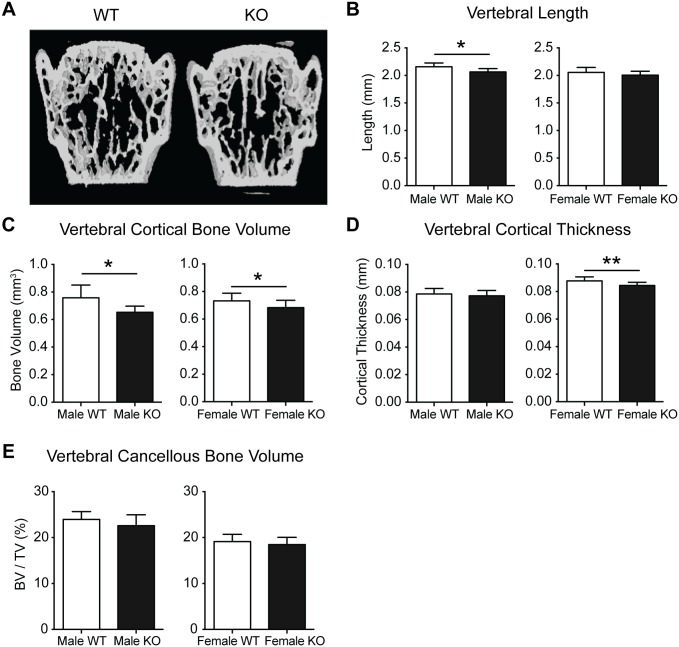
Fig 3. Lumbar vertebral bone analysis of PWCR KO mice.
A.) Representative images and micro CT analysis of L3 vertebral bone :- B.) Vertebral length; C.) cortical bone volume; D.) vertebral cortical thickness; E.) cancellous bone volume. n = 7–10 represented as mean ± SD. * p-value<0.05, ** p-value<0.01.

