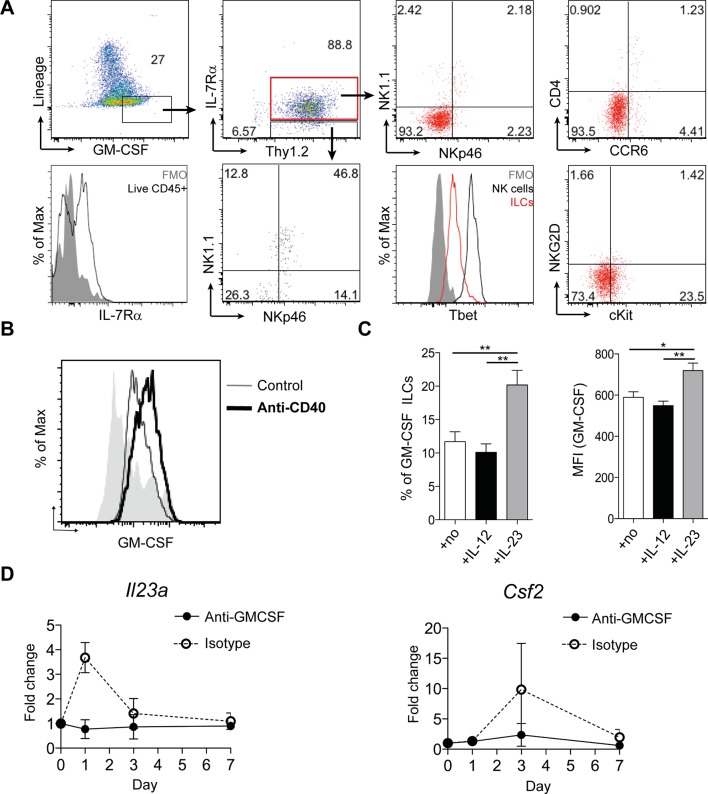
Figure 2. ILCs are a major source of GM-CSF.
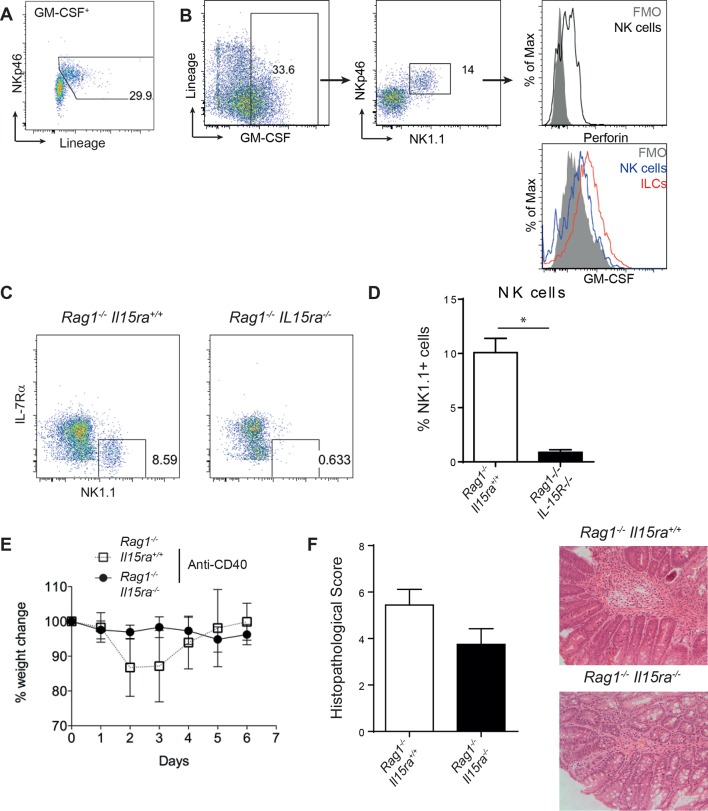
(A) Representative flow cytometric analysis of ILC populations at day 3 following anti-CD40 treatment. Surface marker and GM-CSF expression is shown following 3 hr stimulation with PMA, ionomycin, monensin, and brefeldin A (n=6). Cells are gated on a live cell gate with doublets excluded. GM-CSF expression gating is based on an FMO control. Red marks ILCs and black marks NK cells. Lower left panel shows IL-7Rα staining in live CD45+ cells compared with FMO control. (B) Representative flow cytometric analysis showing GM-CSF production for ILC populations in untreated or anti-CD40 treated mice. The solid grey histogram represents the isotype control. Following doublet exclusion, cells are gated on a live cell gate, then gated on lineage-, CD45+ Thy1.2+ IL-7Rα+ cells. (C) Percent and median fluorescence intensity of GM-CSF expression in CD4- NKp46- ILCs isolated from mice 7d following anti-CD40 injection. Total cLP cells were stimulated over night with IL-12, IL-23 or in medium alone, followed by 3 hr stimulation with PMA, ionomycin, monensin and brefeldin A (n=7). Results are representative of 2–3 independent experiments. (D) mRNA expression of Il23a and Csf2 in proximal colonic lamina propria at various time points following anti-CD40 injection. Results are shown as fold change in target gene relative to hprt compared with day 0 uninjected control mice. Data are shown as means and SEM. Results are pooled from 2 independent experiments with n=4–6 mice per group per experiment. *, p<0.05, **, p<0.01, one-way ANOVA with Bonferroni’s post test. (Figure 2—figure supplement 1) shows analysis of lack of NK cell contribution to colitis.


