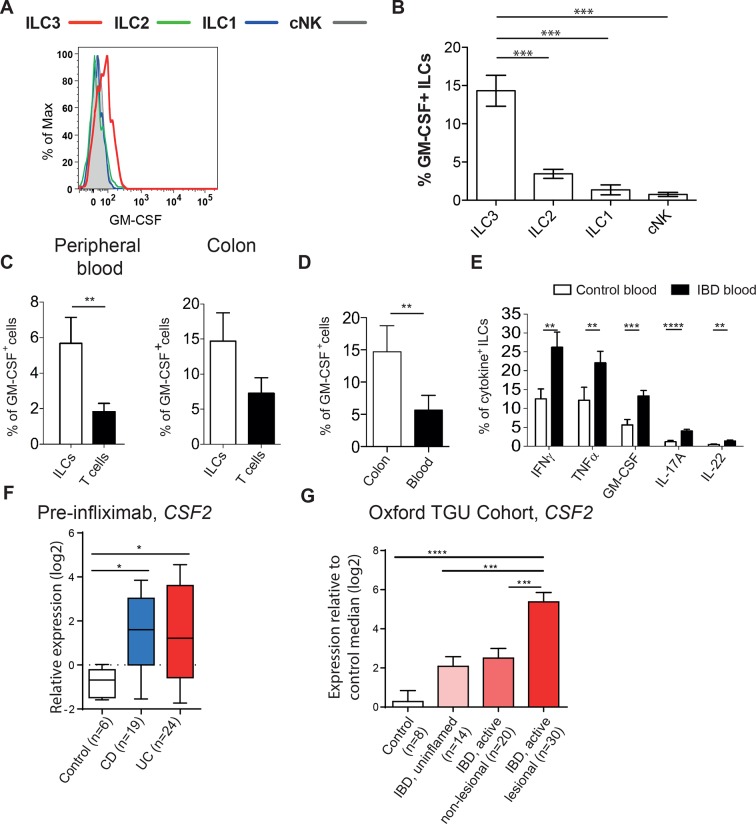
Figure 3. Human ILCs are a source of GM-CSF, which increases in IBD.
(A) Representative flow cytometric analysis of GM-CSF in human blood ILC subsets (following doublet exclusion and gated on live cells, ILCs are lineage-. ILC1 are IL-7Rα+ cKit- CRTH2-, ILC2 are IL-7Rα+ CRTH2+, ILC3 are IL-7Rα+ cKit+ CRTH2-. cNK cells are CD56+ IL-7Rα- CD45RO-) stimulated with PMA, ionomycin and brefeldin A for 4 hr. (B) Quantification of percent of GM-CSF+ blood ILC populations (n=3–6). (C) Percent of human blood and colon ILCs and T cells expressing GM-CSF following stimulation with PMA, ionomycin and brefeldin A for 4 hr (n=5). (D) Comparison of ILCs in blood and colon expressing GM-CSF (n=5). (E) Percent of ILCs expressing pro-inflammatory cytokines in the blood of control and IBD patients following stimulation with PMA, ionomycin and brefeldin A for 4 hr (n=10–15). Results are representative of n=2–5 independent experiments. *, p<0.05, **, p<0.01, ***, p<0.001, ***, p<0.0001 one-way ANOVA with Bonferroni’s post test. (F) Relative expression of CSF2 from the publicly available Leuven cohort (GSE16879) in control, Crohn’s disease, and ulcerative colitis patients before infliximab treatment. (G) Relative expression of CSF2 in the Oxford IBD cohort. Data for individual genes were normalized to the median value of healthy control patients, converted to log2 ratios, and analyzed by one-way ANOVA with Tukey’s multiple comparisons test (data were found to be normally distributed using the D’Agostino and Pearson omnibus normality test).
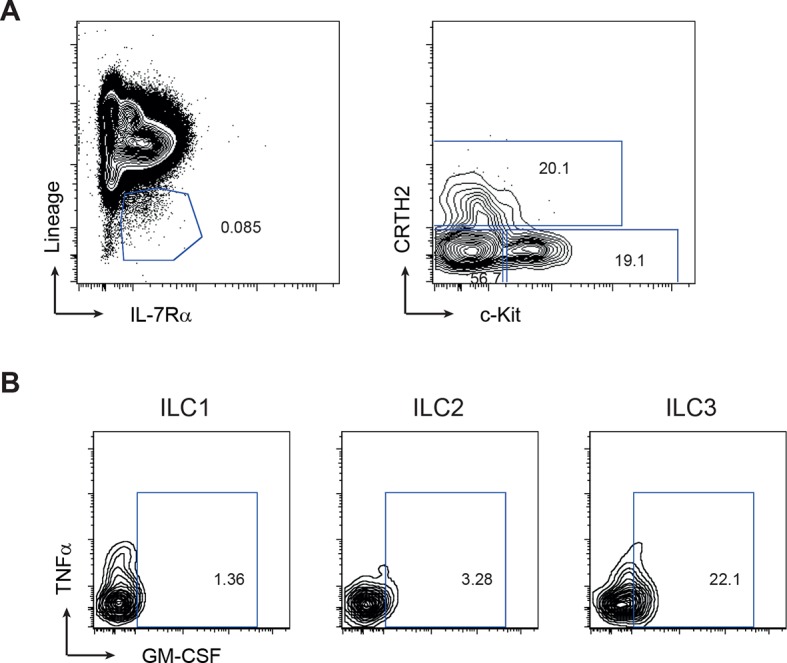
Figure 3—figure supplement 1. Gating strategy for human ILC subsets.


