. 2016 Jan 18;5:e10066. doi: 10.7554/eLife.10066

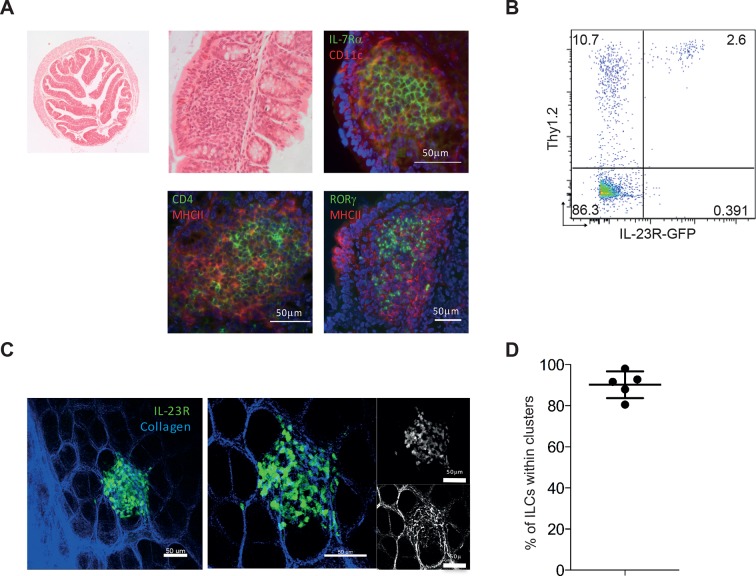
Figure 4. IL-23R marks ILCs that are present in cryptopatches within the gut.

(A) Representative H&E and immunofluorescence staining of cryptopatches in transverse proximal colon sections in B6Rag1-/- mice from the steady state at 2.5x and 20x magnification. (B) Flow cytometry staining of Thy1.2 in the colon LPLs of steady-state Il23rgfp/+ Rag1-/-. (C) Representative image of intact tissue explant of proximal colon from Il23rgfp/+ Rag1-/- mice from the steady state. Left and middle panels show IL-23R (green) and collagen (blue). Right panel shows IL-23R alone (top) and collagen alone (bottom). (D) Quantification of steady-state Il23rgfp/+ Rag1-/- ILCs in clusters within the proximal colon from explant imaging. (Figure 4—figure supplement 1) shows modulation of RORγt and IL-23R after anti-CD40 treatment. Results are representative of 3-4 independent experiments.

DOI: http://dx.doi.org/10.7554/eLife.10066.010

Figure 4.

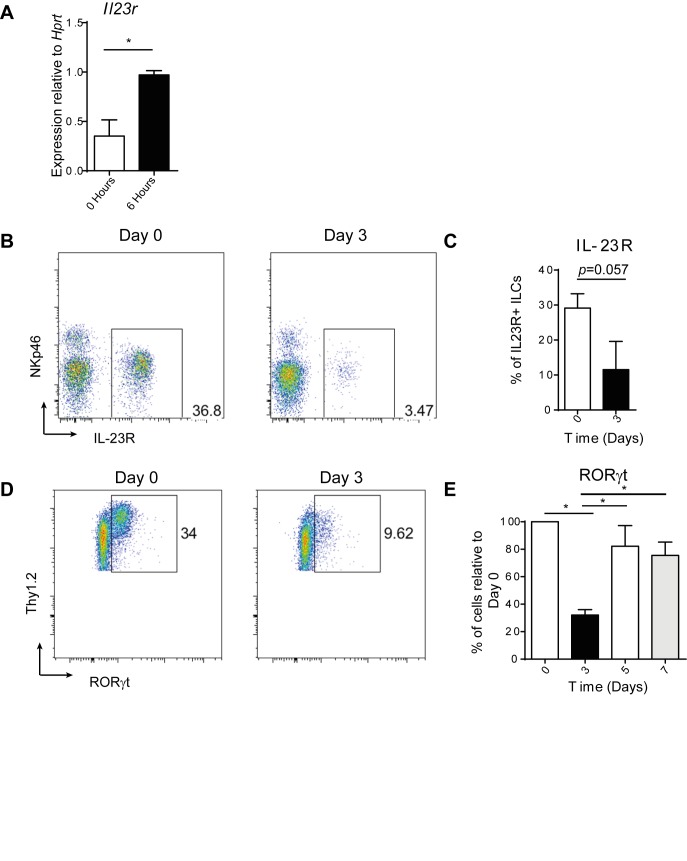
Figure 4—figure supplement 1. RORγt and IL23R expression are affected by anti-CD40 treatment.

Figure 4—figure supplement 1.

(A) Tissue Il23r expression relative to Hprt (n=6). This is a combination of 2 independent experiments. (B) Representative flow cytometric analysis of IL-23R (using Il23rgfp/+ Rag1-/- mice) on cells gated on live cells, CD45+, IL-7Rα+, and Thy1.2+ 0 and 3 days after anti-CD40 treatment. (C) Quantification of IL-23R+ cells as a percent of single, live, CD45+, IL-7Rα+, Thy1.2+ cells (n=4). This is representative of 2 independent experiments. (D) Representative flow cytometric analysis of RORγt staining in cells gated on live, single, CD45+, IL-7Rα+, and Thy1.2+ 0 and 3 days after anti-CD40 treatment. (E) Quantification of the percent of RORγt+ cells relative to Day 0 (n=8–12). This is a combination of 3 independent experiments.