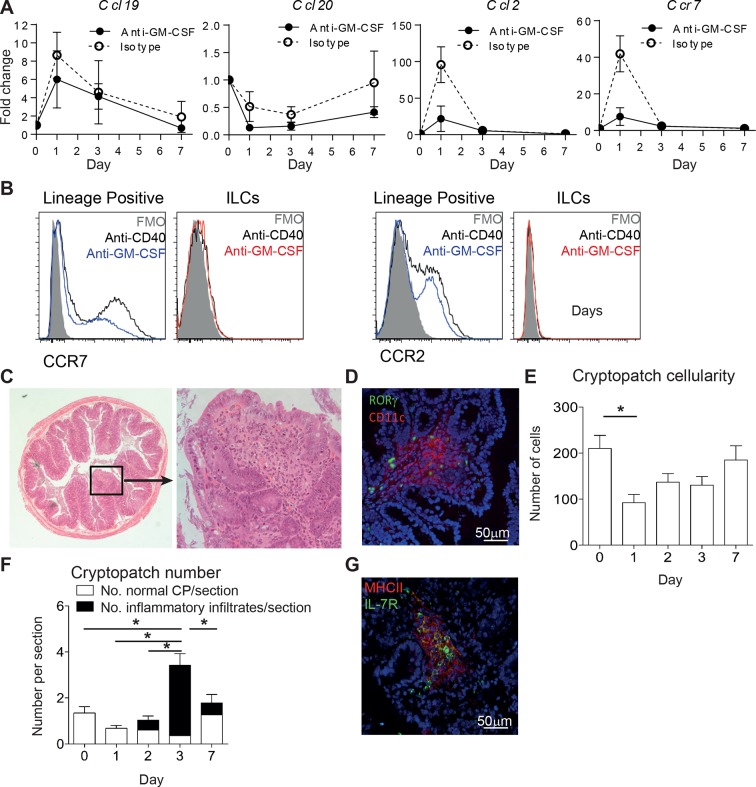
Figure 6. ILC movement precedes tissue reorganization.
(A) mRNA expression of Ccl19, Ccl20, and Ccl2 with the receptor Ccr7 in proximal colonic lamina propria at various time points following anti-CD40 and isotype or anti-GM-CSF injection at days -1, +1, and +3. Results are shown as fold change in target gene relative to hprt compared with day 0 uninjected mice. (B) Representative flow cytometry staining of CCR7 and CCR2 in single live lineage+ cells or ILCs from anti-CD40 or anti-GM-CSF and anti-CD40 treated mice. (C) Representative H&E staining of inflammatory foci (IF) in transverse proximal colon sections in B6Rag1-/- mice at day 7 following anti-CD40 injection at 2.5x and 20x magnification. (D) Representative immunofluorescence of IF in the proximal colon of anti-CD40 treated mice showing CD11c (red), RORγt (green) and DAPI (blue). (E) Number of cells in cryptopatches following anti-CD40 injection as assessed by H&E stained transverse colon sections. (F) Mean number of normal cryptopatches (CP) and areas containing inflammatory infiltrate in H&E stained transverse colon sections. (G) Representative immunofluorescence of a cryptopatch from an anti-GM-CSF and anti-CD40 treated mouse at day 3 showing MHCII (red), IL-7Rα (green), and DAPI (blue). Data are shown as means and SEM. Results are representative of 3–6 independent experiments with n=2–5 mice per experiment. *, p<0.05 One-way ANOVA with Bonferroni’s post test. Data are shown as means and SEM. Results are pooled from 2 independent experiments with n=4–6 mice per group per experiment.

