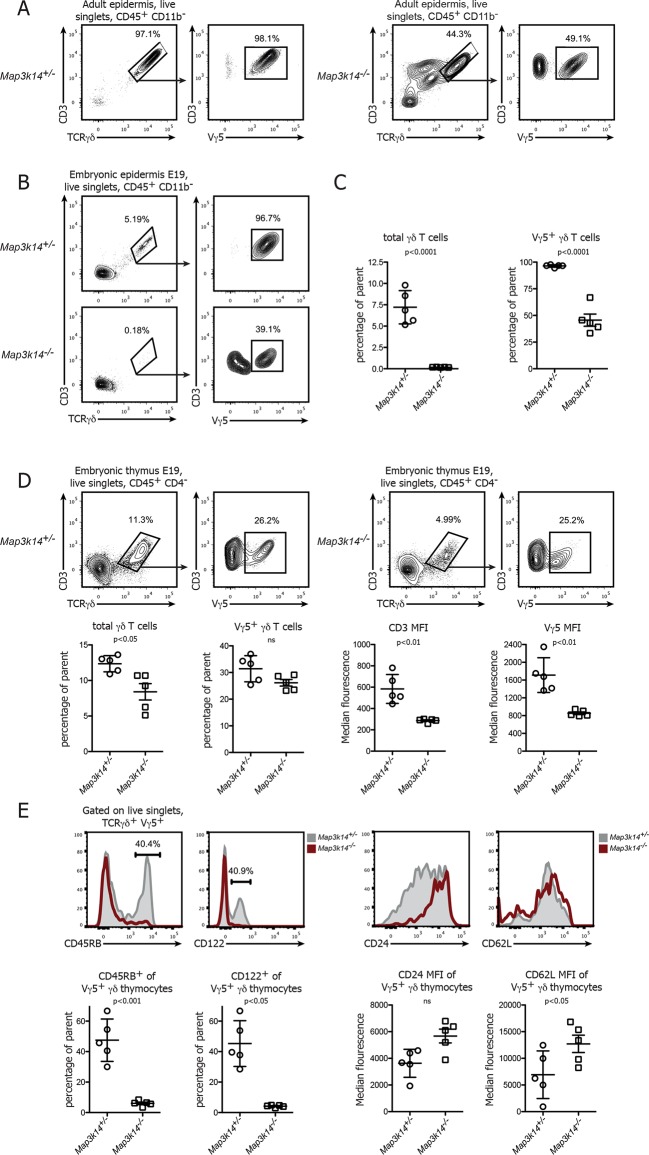
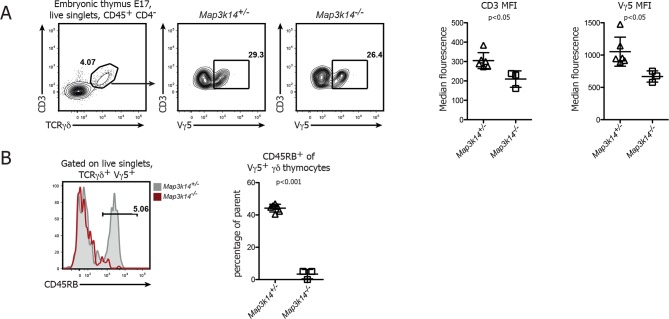
Figure 1. In the absence of NIK, the development of DETCs is blocked in the embryonic thymus.
(A) Lymphocytes isolated from the epidermis of adult heterozygous control (left panel) and Map3k14-/- animals were analysed for the presence of Vγ5+ DETCs. Pregating is on live singlets and CD45+ CD11b- cells. (B) Analysis of the epidermal γδ T cell compartment of heterozygous control (upper panel) and Map3k14-/- embryos (day 19 post conception) after pregating on live singlets and CD45+ CD11b- cells. (C) Summary of the frequency of total γδ T cells as well as Vγ5+ cells within the γδ T cell gate. Data are mean +/- SD and are representative of two similar experiments. (D) Analysis of developing Vγ5+γδ thymocytes in the thymi of E19 embryos. Flow Plots have been pregated on live singlets and CD45+ CD4- cells. Lower panel depicts the summary of the frequency of total γδ thymocytes as well as Vγ5+ cells within the γδ T cell gate in d19 embryonic thymi, and the median fluorescence intensity of the indicated markers. Data are mean +/- SD and representative of two similar experiments. (E) Analysis of the expression level of CD45RB, CD122, CD24 and CD62L on developing Vγ5+γδ thymocytes isolated from E19 embryonic thymi. Grey shaded histograms depict heterozygous controls, red histograms Map3k14-/- cells. Lower panel shows the summary for the frequency of positive cells for CD45RB and CD122 and the median fluorescence intensity of CD24 and CD62L, respectively. Data are mean +/- SD and are representative of two similar experiments.


