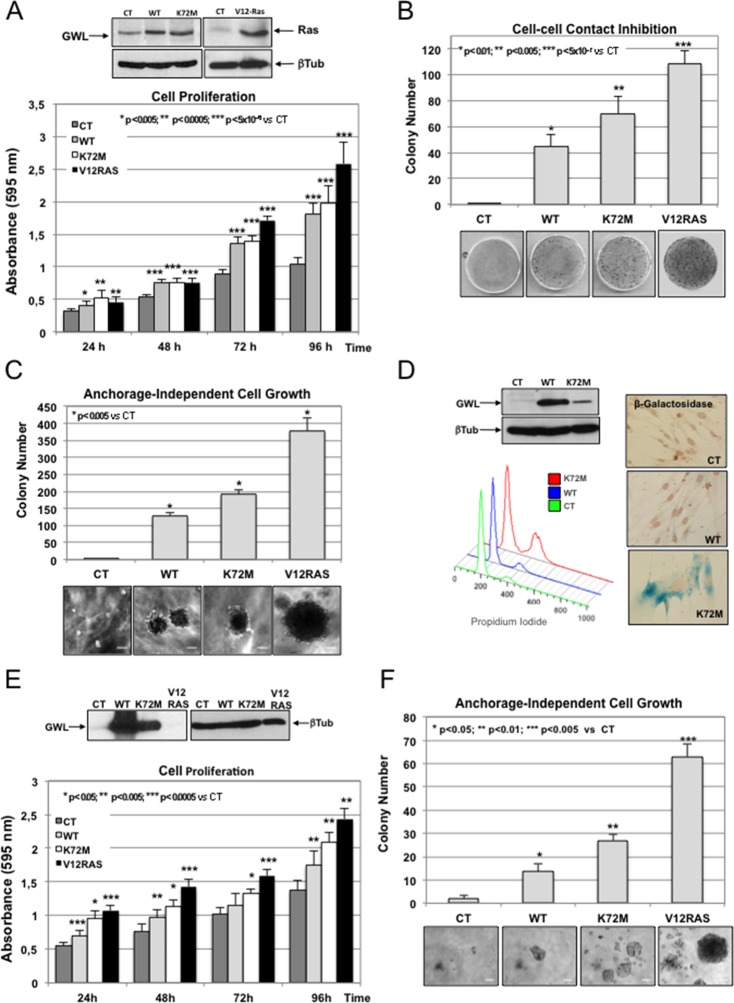
Figure 1. GWL overexpression promotes cell transformation in immortalised mammary gland cells and in primary human fibroblasts.
(A-C) MCF10A cells were stably infected with either empty pMXs vector (CT) or plasmids coding for wild type (WT) or hyperactive (K72M) GWL. A MCF10A stable clone overexpressing the V12RAS oncogene was used as a positive control. Cell proliferation (A), cell—cell contact inhibition (B) and anchorage-independent cell growth (C) were assayed in these cells. Colonies stained by crystal violet in normal seeded plates (cell—cell contact inhibition) or in soft-agar plates (anchorage-independent cell growth) were counted and results presented in a graph. Results are shown as the mean of three different experiments ± SD. Two-tailed unpaired Student t tests were performed to determine statistical relevance; significant p values are shown. Scale bars, 60 μm. (D) Primary human fibroblasts were infected with empty pMXs vector (CT) or with plasmids coding for the indicated GWL proteins. FACS profile and β-Galactosidase staining (blue) of these cells are shown. (E,F) Human fibroblasts expressing hTERT and SV40 T large antigen were infected with an empty vector (CT) or with plasmids encoding WT or K72M GWL. An hTERT-SV40-V12Ras cell line was used as a positive control. Cell proliferation (E) and anchorage-independent cell growth (F) are shown. Results are the mean ± SD of three different experiments. Two-tailed unpaired Student’s t tests were performed to determine the statistical relevance; significant p values are shown. Scale bars, 100 μm. SD, standard deviation.
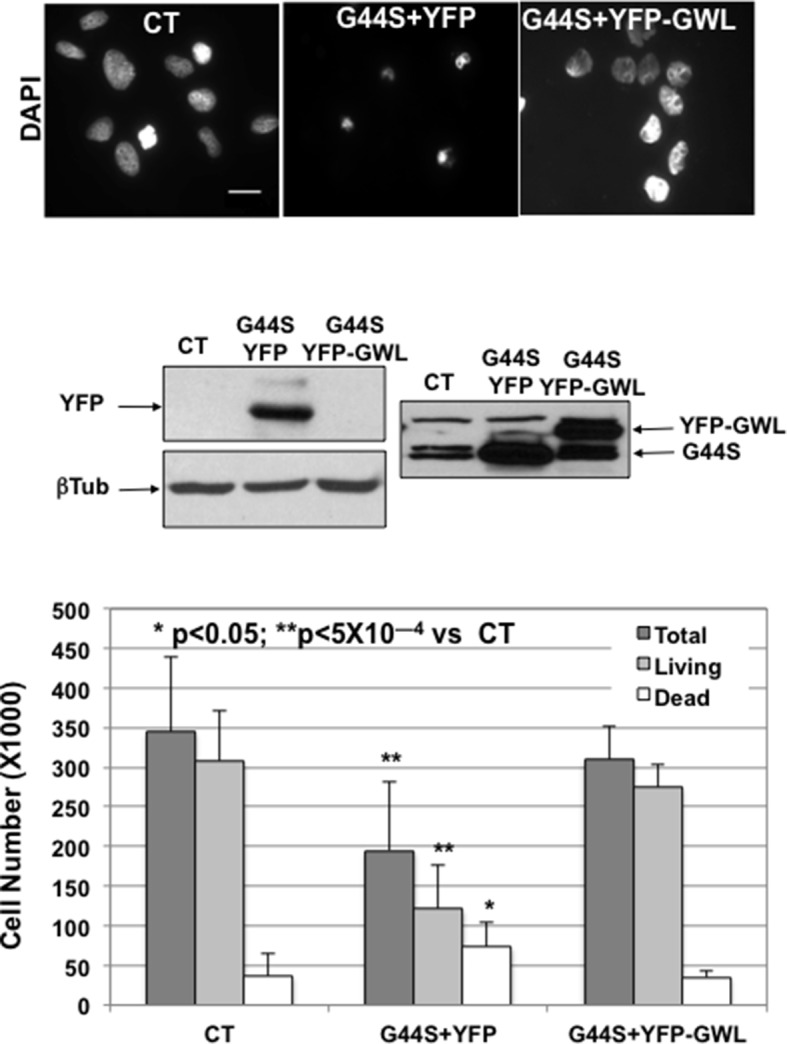
Figure 1—figure supplement 1. G44S kinase dead form of GWL in MCF10A cell lines could act as dominant-negative of endogenous GWL.


