
Figure 3. GWL overexpression promotes tumour growth in vivo and increases AKT phosphorylation on S473.
(A) Two representative animals with tumours induced by subcutaneous injection of MDA-MB-231 cells stably infected with the pMXs empty vector (CT) or this plasmid encoding wild type GWL (GWL) (left animal, tumours 1 and 2, respectively) or D3H2LN cells that stably express SH LUC or SH GWL (right animal, tumours 3 and 4, respectively). Photographs show animals and tumours at the end of the experiment. Tumour size (mean ± SEM) was measured at different time points after xenograft in both groups of animals (n=4). Two-tailed unpaired Student’s t tests were performed to determine the statistical relevance; significant p values are shown. (B) The indicated cell clones were lysed and equal amounts of total proteins were incubated with the human phospho-kinase array. GSK3 α/β phosphorylation at S9/S21 in the different cell lines are shown. AKT phosphorylation at S473 correlated with the GWL expression level in all tested cell lysates. Shown is the percent of increase of S473 phosphorylation signal calculated by densitometry using the ImageJ software in GWL overexpressing cells compared to CT or in GWL knockdown cells compared SH LUC cells. GWL, Greatwall.

Figure 3—figure supplement 1. Phosphorylation of S308 of AKT is identical in the different GWL overexpressed and knockdown cells.
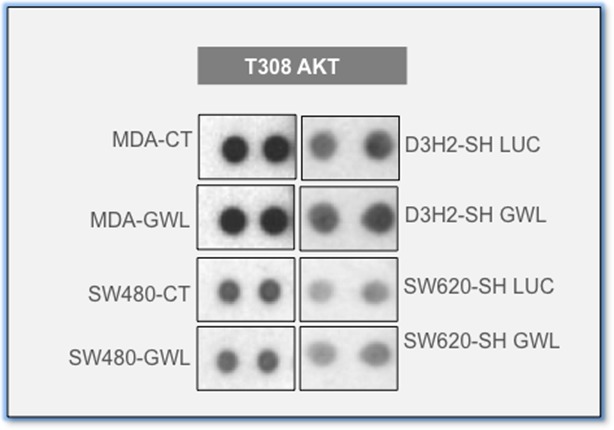
Figure 3—figure supplement 2. Akt phosphorylation of S473 is increased in all cell lines overexpressing active GWL.
