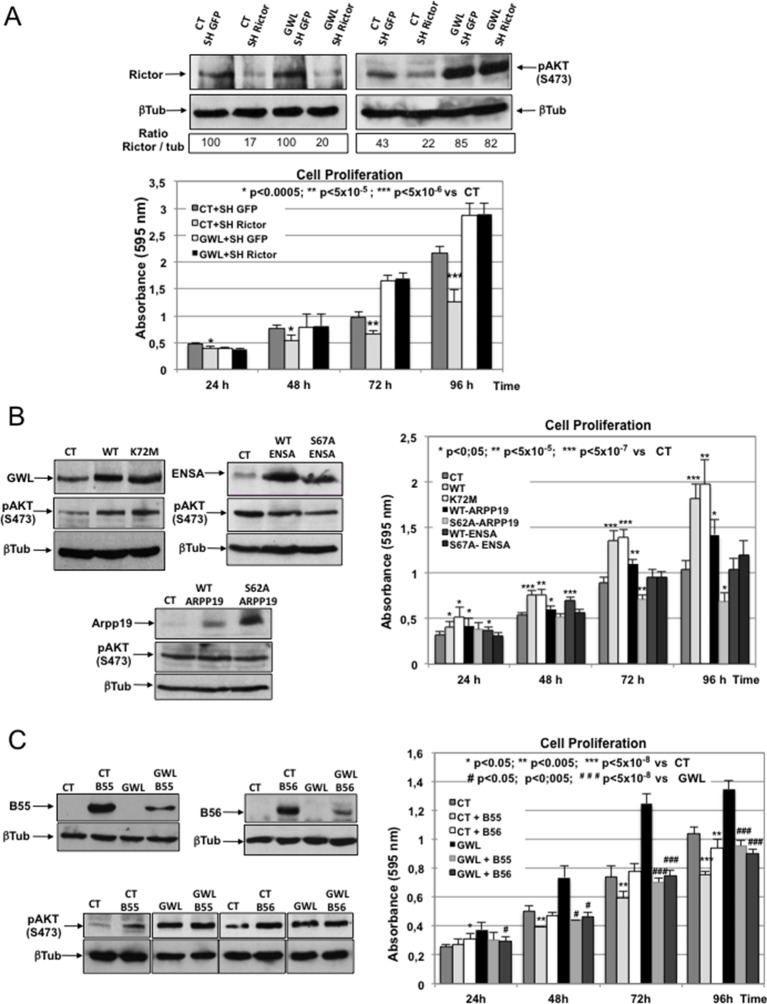
Figure 5. AKT phosphorylation on S473 induced by GWL overexpression is neither due to increased mTORC2 activity nor to decreased PP2AB55 activity through ARPP19/ENSA phosphorylation.
(A) Control or GWL-overexpressing MDA-MB-231 cells were stably infected with control (SH GFP) or Rictor shRNAs (SH Rictor) and the levels of Rictor and AKT phosphorylation at S473 were determined by Western blotting. The Rictor / β-tubulin ratio and AKT phosphorylation at S473 / β-tubulin ratio were calculated by densitometry using the ImageJ software. Cell proliferation in these cells was also measured. (B) MCF10A cells were infected with viruses encoding the indicated proteins and the expression levels of ARPP19, ENSA, β-tubulin, and AKT phosphorylated at S473 were determined. Cell proliferation in the different cell lines was also assessed. Results are the mean ± SD of three different experiments. Two-tailed unpaired Student’s t tests were performed to determine the statistical relevance; significant p values are shown. (C) MDA-MB-231 cells that stably express GWL (GWL) or not (CT) were transfected with B55 or B56 and the levels of these two proteins and of phosphorylated AKT at S473 were analysed by Western blotting. Cell proliferation was then measured and results shown in a bar graph (mean ± SD). Two-tailed unpaired Student’s t tests were performed to determine the statistical relevance; significant p values are shown. GWL, Greatwall; SD, standard deviation.
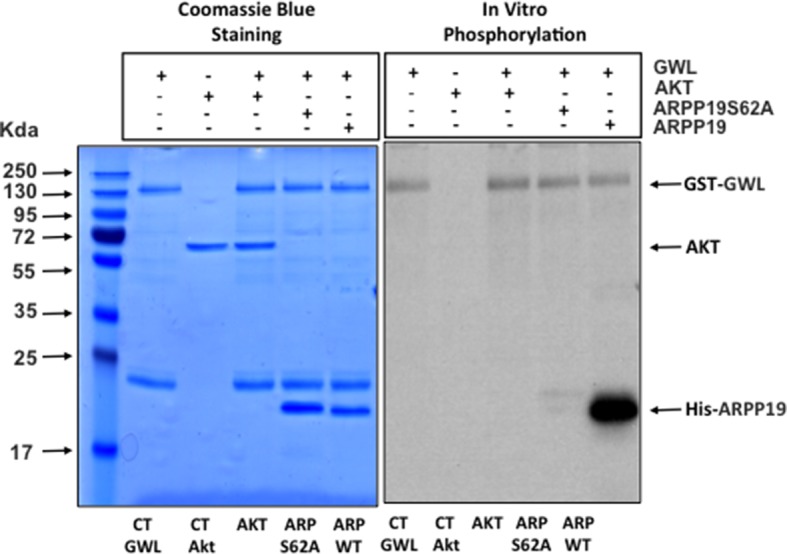
Figure 5—figure supplement 1. GWL does not directly phosphorylate AKT.


