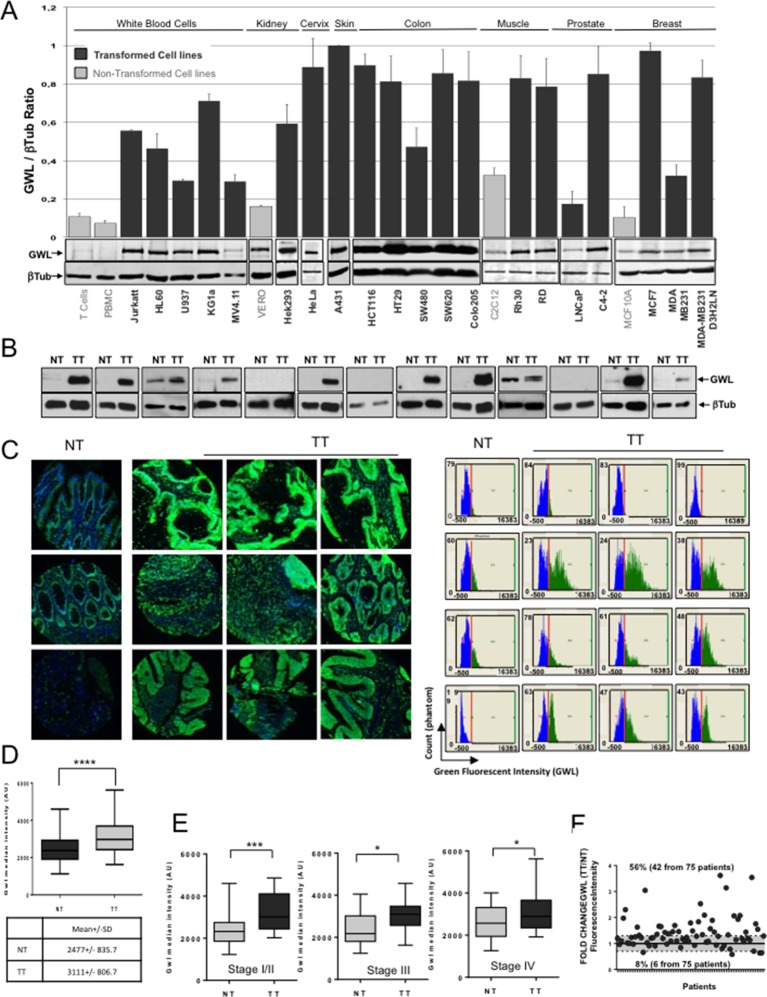
Figure 8. GWL overexpression is a common feature in transformed cell lines and in colorectal cancer.
(A) GWL level in the indicated cell lines was assessed by Western blot analysis (lower panels) and the GWL / β-tubulin ratios shown in a bar graph (upper panel). (B) The expression levels of the GWL kinase and β-tubulin in crude extracts prepared from 13 sets of matched non-tumour (NT) and tumour (TT) samples from patients with stage IV primary colorectal adenocarcinomas were measured by Western blotting. (C) Representative images (left panels) and corresponding quantitative analysis (right panels) of GWL expression (green) in normal tissue (NT) and matching tumour (TT) after immunofluorescence staining of a colorectal TMA. The blue colour corresponds to DAPI staining. (D) Quantification of GWL expression in the NT and TT samples of (C). The median fluorescence intensity of the GWL signal was determined in the NT and TT samples of each patient and used to construct a box and whisker plot. GWL mean fluorescence intensity in each tissue is shown in the table (****p<0.0001 by paired t-test). (E) GWL median fluorescence intensity in the NT and corresponding TT of (C) according to the tumour stage (stage I/II: n=28, stage III: n=17 and stage IV: n=28 patients). ***p<0.001; *p<0.05 (paired t-test). (F) The fold change in GWL fluorescence intensity was calculated as the TT fluorescence intensity/NT fluorescence intensity ratio for each patient. The grey area represents the minimum threshold (20% increase/decrease) for considering GWL expression in TT as up-regulated or down-regulated compared to TT.

