
Figure 1. Experimental design and performance.
(a) Depiction of contextual modifications between environments. Each colored box represents a different target store. Cities 1 & 2 (similar cities) are identical aside from swapped position of stores (purple and teal). City 3 (interference city) shares the same stores as similar cities but in a novel layout. City 4 (distinct city) has a novel layout and stores. (b) During encoding participants completed 4 rounds of navigation and map drawing of each city. (c) Retrieval consisted of 8 blocks of city-specific distance judgments. (d) Retrieval accuracy demonstrates lower performance on city 3. **p<0.01
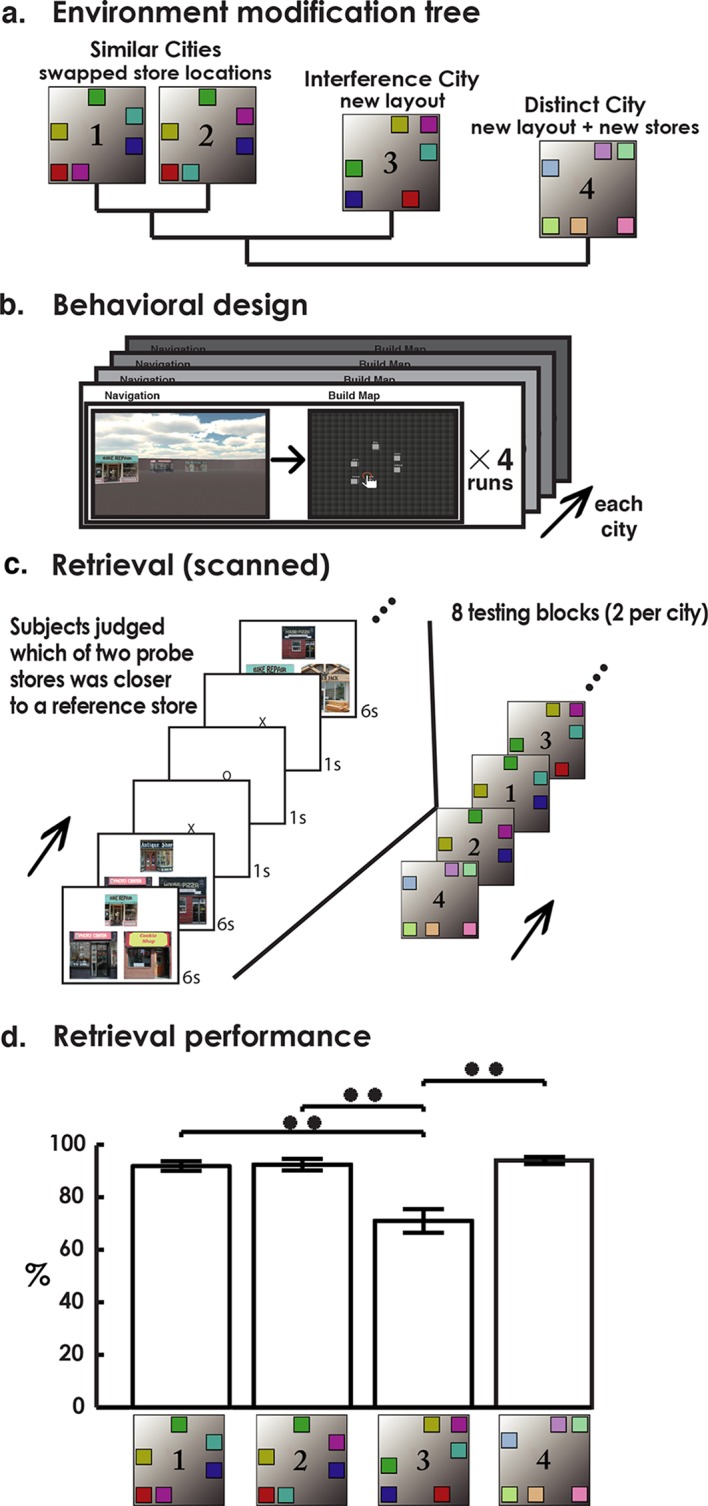
Figure 1—figure supplement 1. Map drawing learning curves.

Figure 1—figure supplement 2. City transition map scores.
