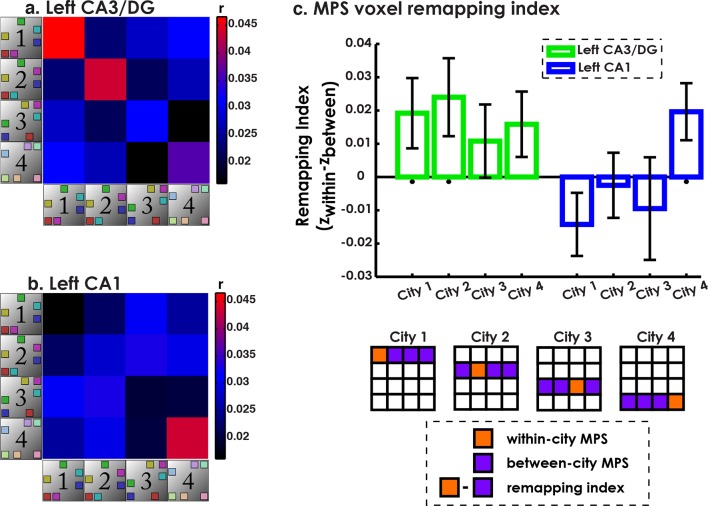
Figure 4. Multivariate pattern similarity analysis (MPS) ofenvironment similarity during retrieval.
(a) Similarity matrix of all pairwise city MPS conditions in CA3/DG. Diagonal depicts within-city and off-diagonal depicts between city MPS conditions. (b) Same as (a) for CA1. (c) Voxel remapping index for CA3/DG (green) and CA1 (blue). Remapping index for each city was the z-transformed contrast between within city and average between cities MPS (see legend below). Left CA3/DG showed overall more remapping than CA1, with significant remapping for Cities 1 & 2 and marginally significant remapping for City 4. Left CA1 showed significant remapping only for City 4. *p<0.05.


