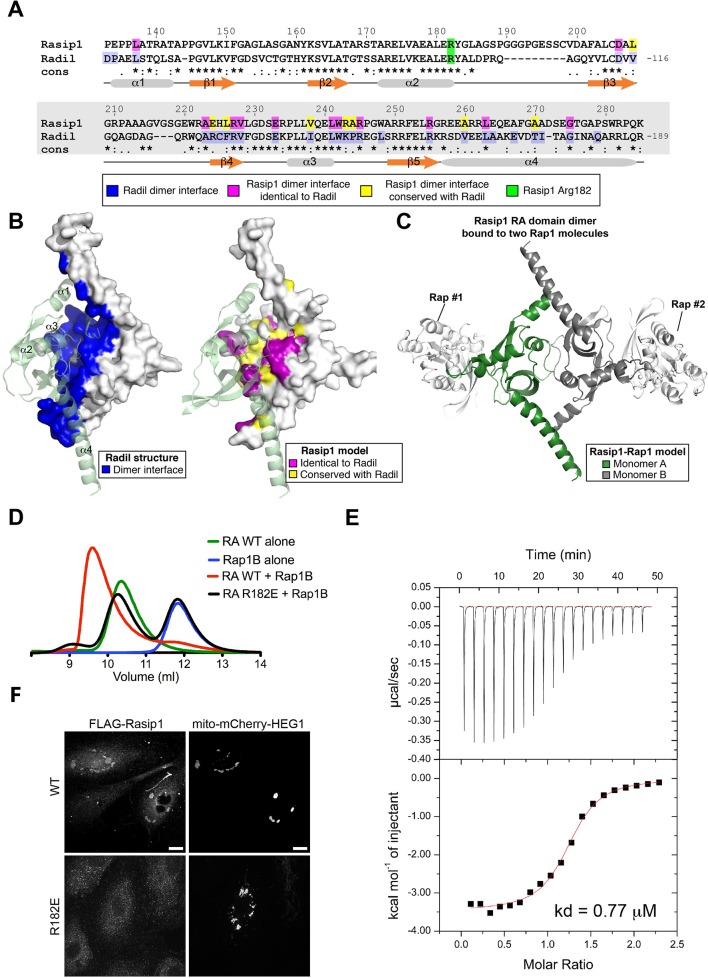
Figure 8. Rasip1 RA domain forms a dimer, and Rasip1 Arg182 is important for high affinity Rap1 binding.
(A) Sequence alignment of human Rasip1 RA domain with human Radil. Symbols denote the degree of conservation: (*) identical, (:) conservative substitution, and (.) semi-conservative substitutions. Secondary structure elements of Radil are shown below the alignment. (B) Left: Crystal structure of Radil dimer with the dimer interface highlighted in blue (PDB: 3EC8). Right: Residues 134-285 from Rasip1 were modeled using the Radil RA domain crystal structure as a template. View of Rasip1 RA domain dimer with the dimer interface highlighted: identical to Radil (magenta) and conserved (yellow). The residues highlighted are also shown in panel A with the same color code. (C) Model of the Rasip1 dimer with two RA motifs located at opposite ends suggesting it can bind two Rap1 molecules as shown. (D) Binding of the Rasip1 RA domain wild-type and R182E to Rap1 as analyzed on a Superdex-75 (10/300) gel filtration column at room temperature. Incubation of Rasip1 wild-type with Rap1 (red) resulted in complex formation with a shift towards lower volume of elution. In contrast, incubation of Rasip1(R182E) with Rap1 (black) resulted in no interaction with both proteins staying in the free state, suggesting a large reduction in affinity. Furthermore, purified Rasip1 RA domain (50 μM) alone had a large apparent molecular mass (37 kDa; green) as determined by gel filtration compared with a calculated value of 16.3 kDa, suggesting that it forms a dimer in solution. (E) Calorimetric titration of Rap1, out of the syringe into Rasip1 RA domain in the sample cell (kd = 0.77 μM). The titrations were done using monomer concentrations of Rasip1 RA domain. These data show that each Rasip1 dimer can bind two Rap1 monomers. (F) HUVECs, transfected with mito-mCherry-HEG1, were analyzed by Spinning Disk Confocal Microscopy (SDCM) for wild-type (WT) Rasip1 or Rap1-binding deficient Rasip1(R182E) localization which was visualized by FLAG staining. A fraction of wild-type Rasip1, but not Rasip1(R182E), was targeted to mito-mCherry-HEG1 positive structures. Representative images of 3 independent experiments are shown. Scale bars, 10 µm.

