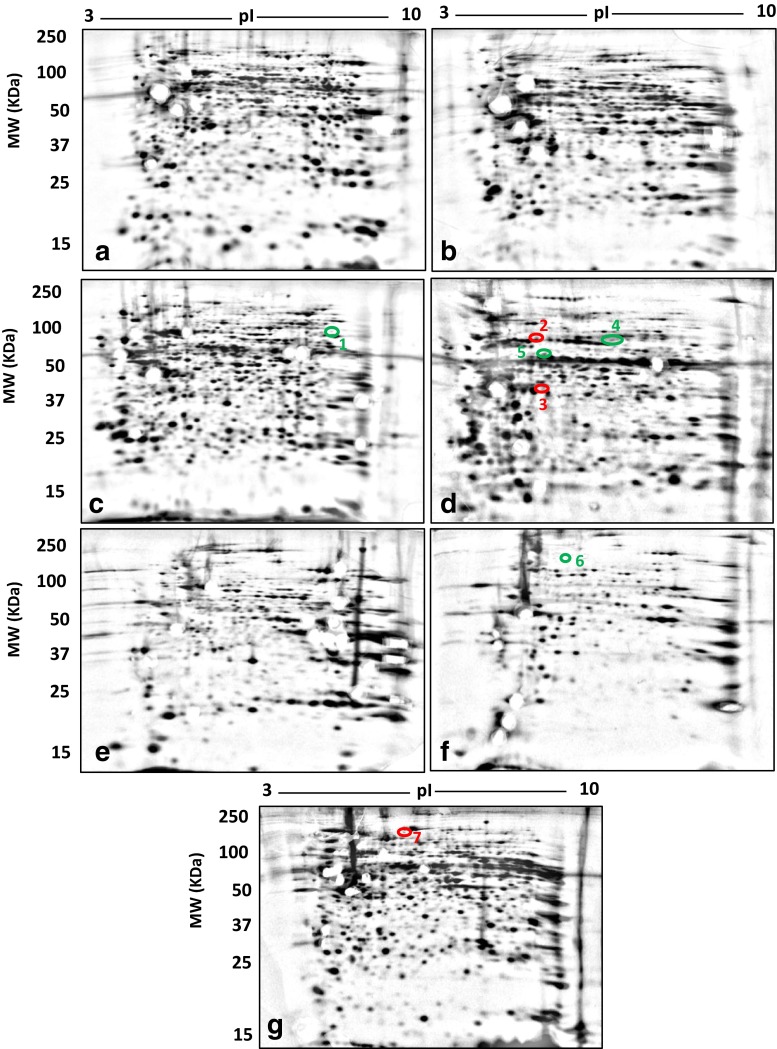
Fig. 3.
Resolved soluble (a, c, e) and membrane (b, d, f) proteomes assessed by deep imaging analysis of cortex (a, b), spleen (c, d) and skeletal muscle (e, f) 2DE gels. Total proteome of PBMCs (g). Each gel image represents a fused image of controls and corresponding cuprizone treatments. Red circles represent protein species uniquely detected in controls relative to cuprizone treatments. Green circles represent protein species uniquely detected in cuprizone treatments relative to controls

