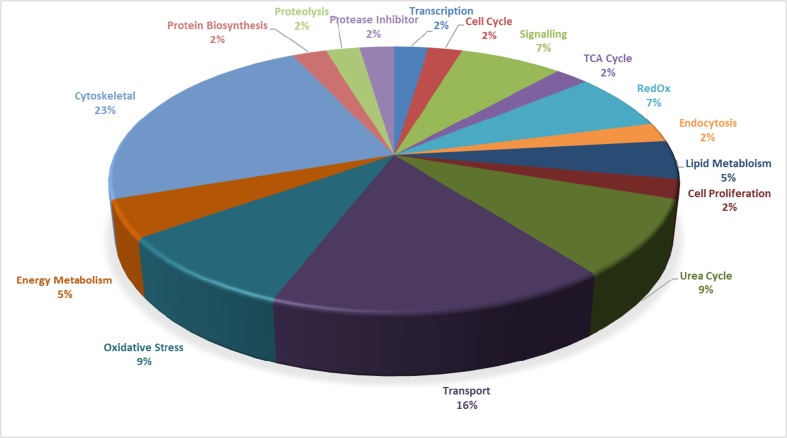
Fig. 4.
Pie graph of the identified protein species grouped according to biological functions. Representative pie graph displays all protein species identified for all tissues (i.e. cortex, spleen, PBMCs and skeletal muscle) and fractions (i.e. MP and SP) from both the standard and deep imaging analyses

