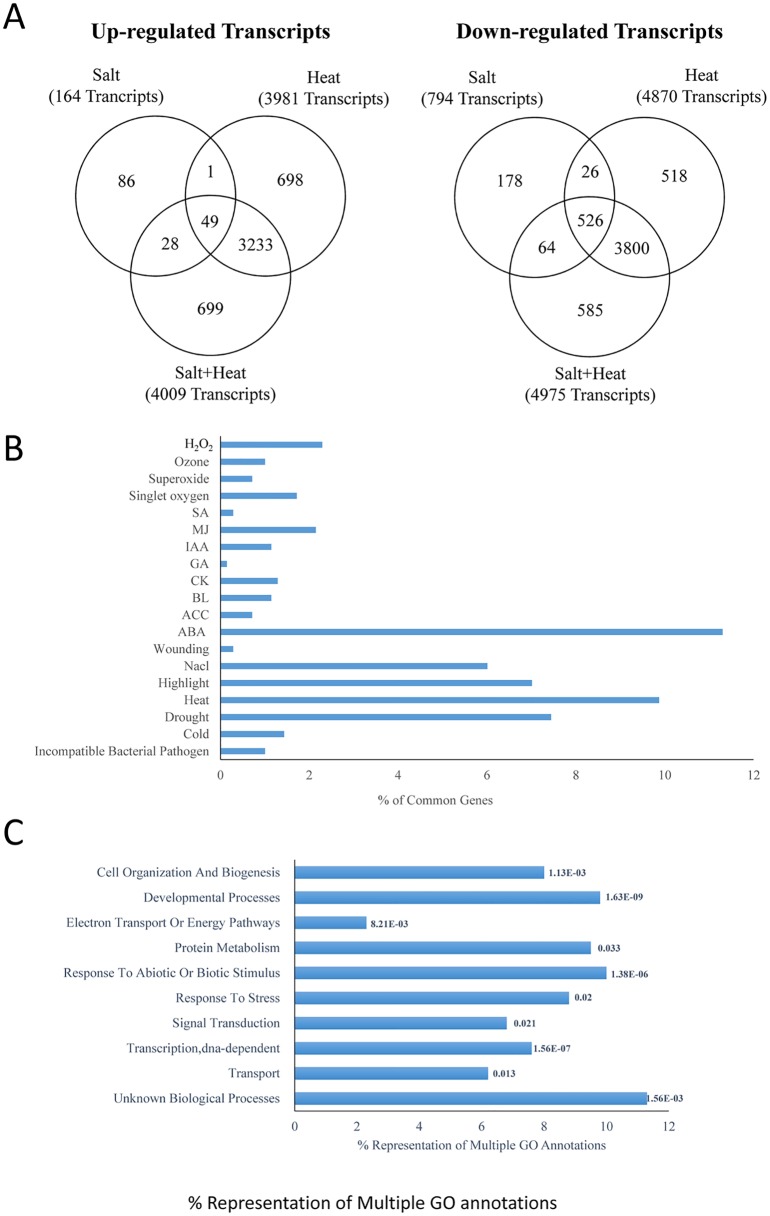
Fig 3. Transcriptomic analysis of Arabidopsis plants subjected to salt, heat and a combination of salt and heat stress.
(A) Venn diagram showing the overlap between transcripts significantly up- or down-regulated in response to salt, heat and a combination of salt and heat stress. (B) Representation of ROS-, hormone-, and abiotic/biotic stress- response transcripts within the group of transcripts that are significantly up-regulated in response to the combination of salt and heat stress. (C) GO annotation of the transcripts specifically up-regulated in response to a combination of salt and heat stress.

