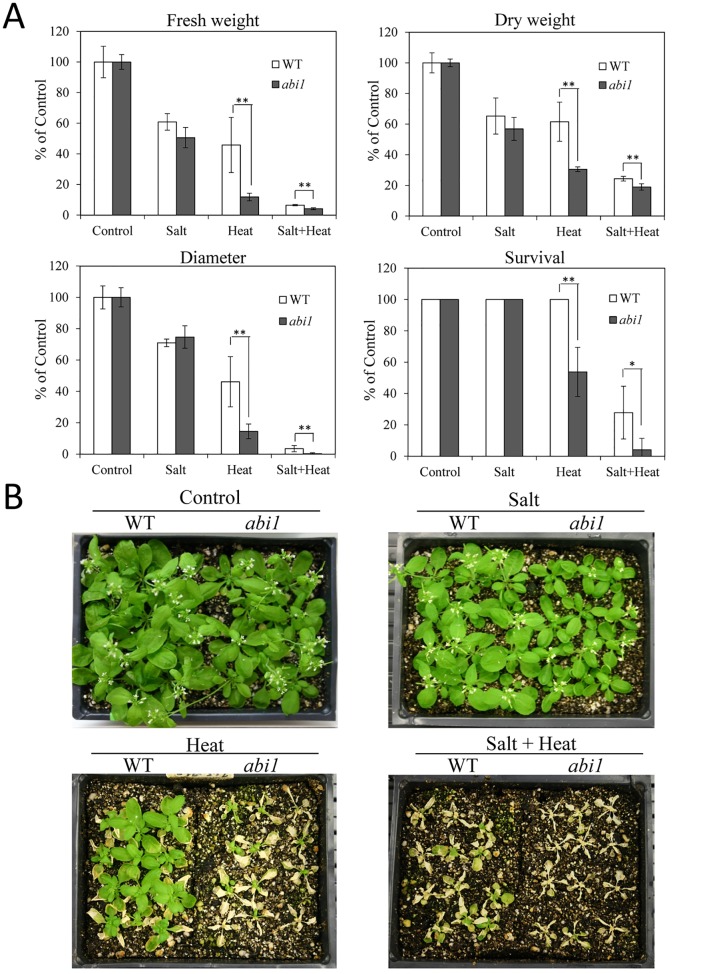
Fig 6. Response of abi1 plants to salt, heat and a combination of salt and heat stress.
(A) Growth parameters and survival of plants subjected to salt, heat and a combination of salt and heat stress. (B) Representative images of plants subjected to the different stresses. * or **, Student’s t test significant at *P < 0.05 or **P < 0.01 compared to WT (n = 30). Error bars represent SD. Absolute values for the graphs shown in (A) are presented in S10 Fig.

