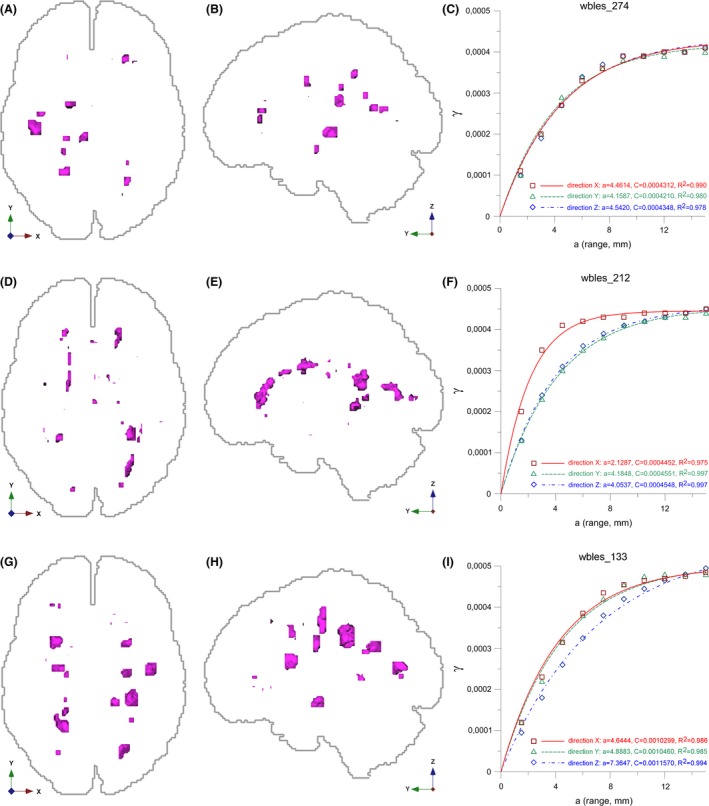
Figure 3.

Relation of MS‐lesion pattern geometry, empirical variograms, and fitted variogram models and their estimated parameters. Projections of three MS‐lesion patterns (magenta) to (left image) axial and (middle image) sagittal planes, white matter outlines (light gray), and axis tripod (directions) for reference. (A, B) Case wbles_274, pattern with dominantly geometrically isotropic MS‐lesions, total lesion load = 2666 mm3. (D, E) Case wbles_212, pattern with dominantly geometrically anisotropic MS‐lesions, total lesion load = 2943 mm3. (G, H) case wbles_133, pattern with dominantly geometrically anisotropic MS‐lesions, total lesion load = 6571 mm3. (C, F, I) Associated directional empirical variograms, fitted exponential variogram models, estimated a and c parameters and quality of model fitting (R 2). Color coding of directional empirical variograms and variogram models: Red X, green: Y, blue: Z. See text for details.
