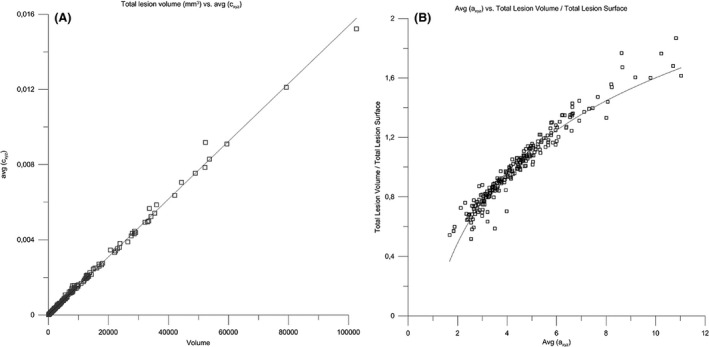
Figure 4.

Correlations of geostatistical parameters a and c with total volume and total surface area of MS‐lesion patterns in the MS‐259 dataset. (A) Correlation of total lesion volume with c (R 2 = 0.997). (B) Correlation of (total lesion volume/total lesion surface) with a (R 2 = 0.941).
