Figure 8.

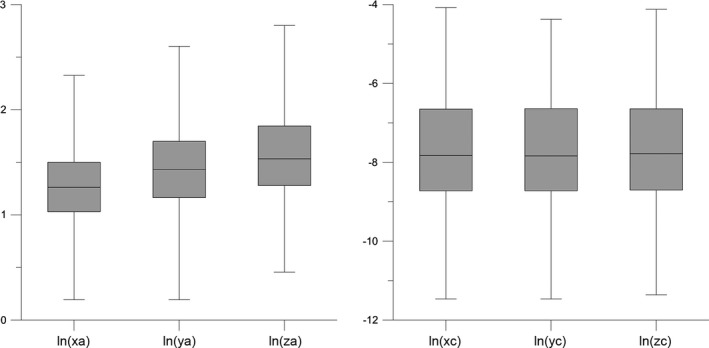
Box‐plots of Figure 6 marginal distributions: ln(xa), ln(ya), ln(za), ln(xc), ln(yc), ln(zc)). Box is bounded by first and third quartile, line in box is median. Whiskers indicate minimum and maximum. See text for details.

Box‐plots of Figure 6 marginal distributions: ln(xa), ln(ya), ln(za), ln(xc), ln(yc), ln(zc)). Box is bounded by first and third quartile, line in box is median. Whiskers indicate minimum and maximum. See text for details.