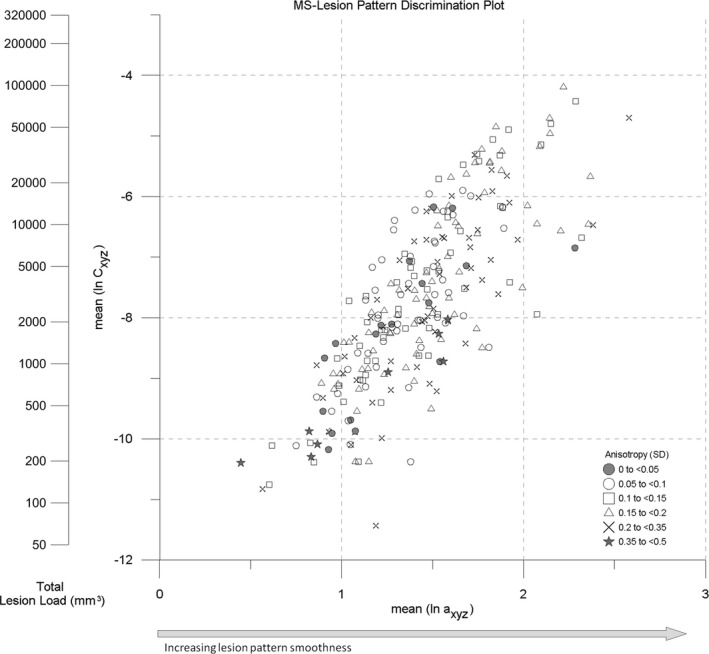
Figure 9.

MS‐Lesion Pattern Discrimination Plot (LDP) combining the mean center (MC) positions and standard distance (SD) class symbols. Second y axis (nomogram) indicates total lesion load (TLL, mm3). Arrow indicates increasing pattern surface smoothness.
