Figure 10.

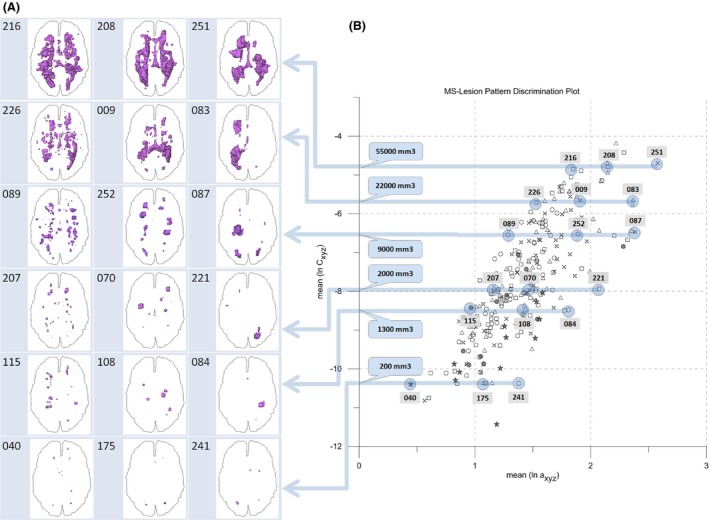
Comparison of projections of MS‐lesions to the axial plane with associated locations in the LDP. 18 MS‐lesion patterns are shown from the MS‐259 dataset. WM outline is shown for reference. See text for details.

Comparison of projections of MS‐lesions to the axial plane with associated locations in the LDP. 18 MS‐lesion patterns are shown from the MS‐259 dataset. WM outline is shown for reference. See text for details.