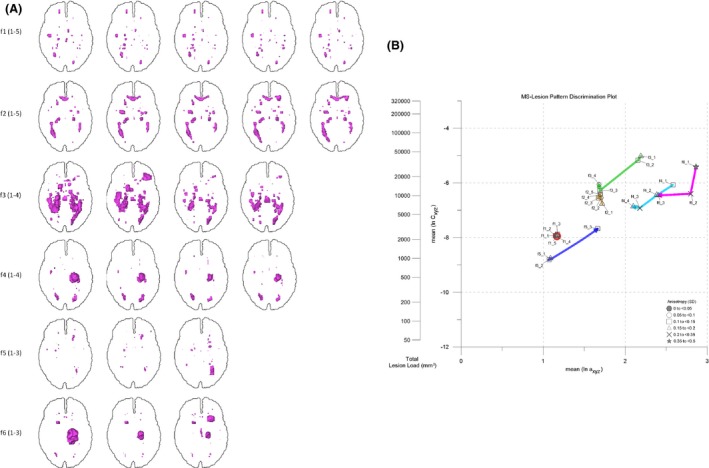
Figure 11.

(A) Longitudinal studies f11–5, f21–5, f31–4, f41–4, f51–3, f61–3 (line‐oriented, order of follow ups from left to right). MS‐lesion patterns in projections to axial plane. See text for discussion. (B) LDP used to portray the evolution of MS‐lesion patterns f11–5, f21–5, f31–4, f41–4, f51–3, f61–3. Arrows indicate MS‐lesion pattern evolution paths. Color coding: f1 – red; f2 – gold; f3 – green; f4 – cyan; f5 – blue; f6 – magenta. See text for details.
