
Fig 3. Galvanic current, lactate concentrations, and Fe(II) concentrations (panels A-C, respectively) measured in split-chamber incubations.
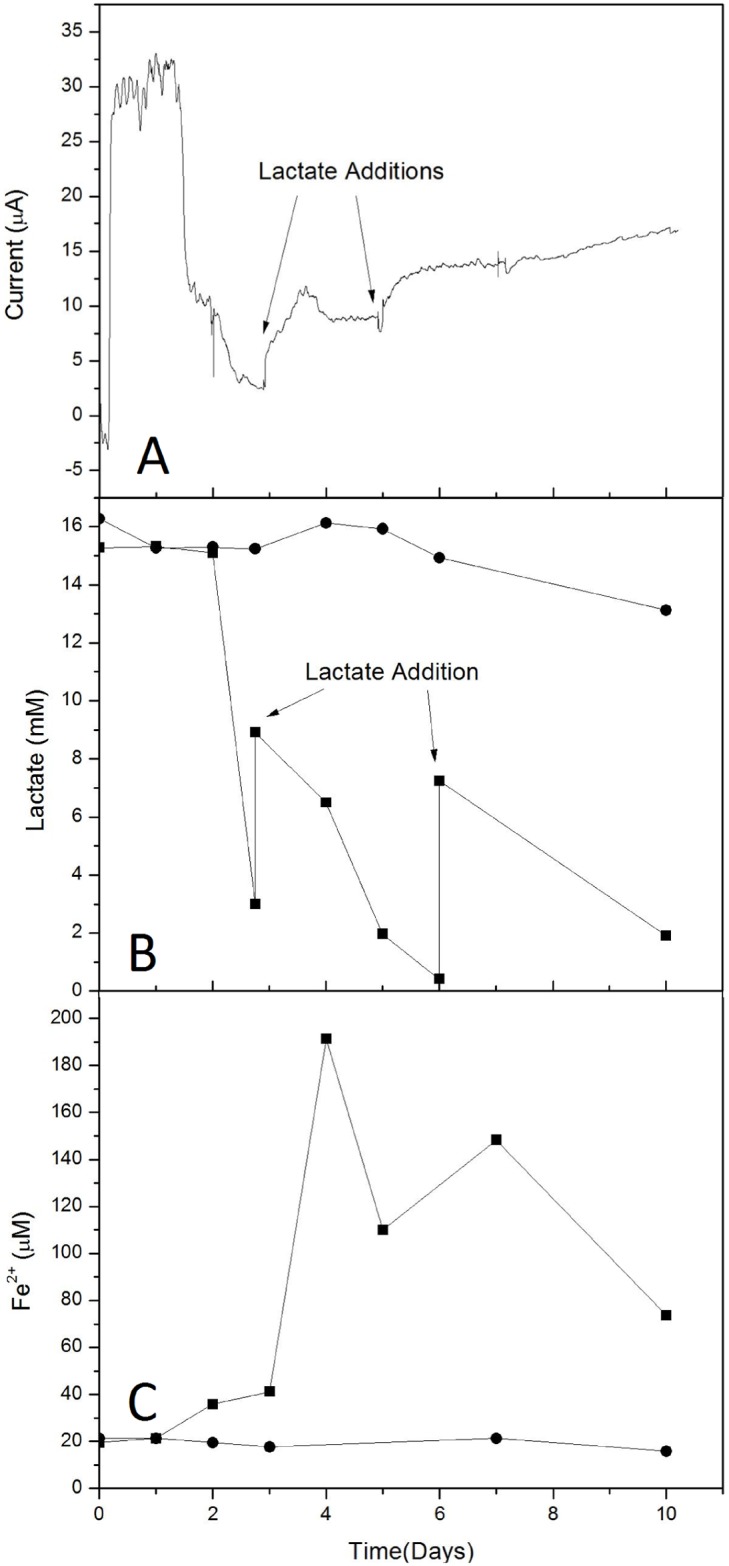
Lactate and Fe(II) concentrations in WE1 (which received S. oneidensis and lactate amendments) and WE2 chambers are depicted with ■ and ●, respectively.