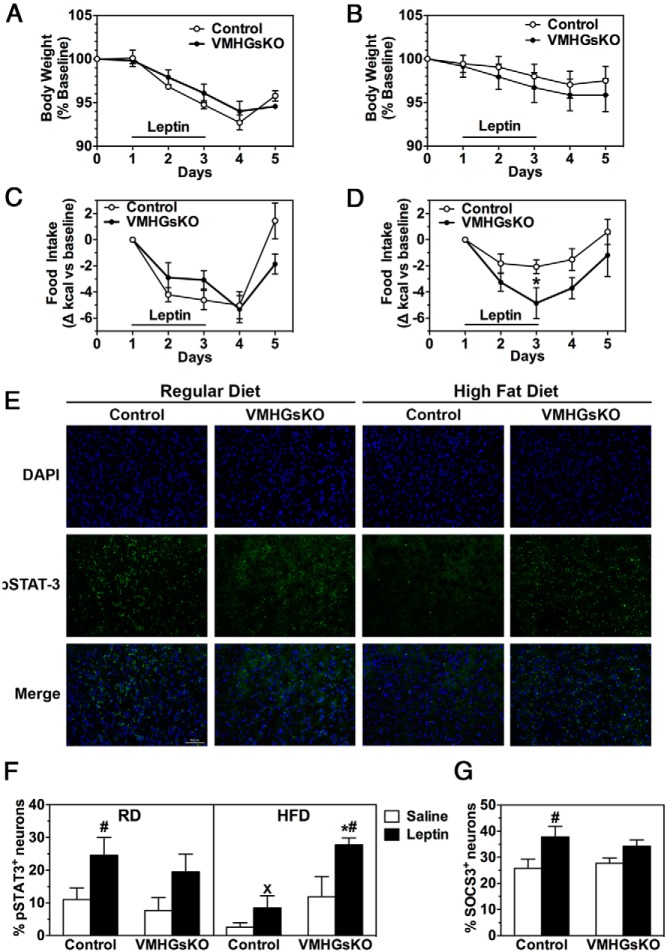
Figure 5.
VMHGsKO mice maintain leptin sensitivity on a HFD. A–D, Body weight (A and B) and daily food intake (C and D) during leptin administration of male control and VMHGsKO mice maintained on either a RD (A and C) or 5 months of a HFD (B and D). E, Representative images of VMH showing 4′,6′-diamidino-2-phenylindole (DAPI) staining (top panels), phosphorylated STAT3 staining (pSTAT3; middle panels), and merged images (lower panels) from control and VMHGsKO mice on a RD (left panels) or 5 months of HFD (right panels). Scale bar, 50 μm. F, Quantification of the percentage of pSTAT3+ VMH neurons from control and VMHGsKO mice maintained on a RD or HFD after treatment with saline or leptin (n = 4–8/group). G, Quantification of percentage of SOCS3+ VMH neurons in male mice maintained on a HFD for 5 months after treatment with saline or leptin (n = 4–7/group). *, P < .05 vs control; #, P < .05 vs saline; x, P < .05 vs RD analyzed by one-way ANOVA.

