Figure 6.
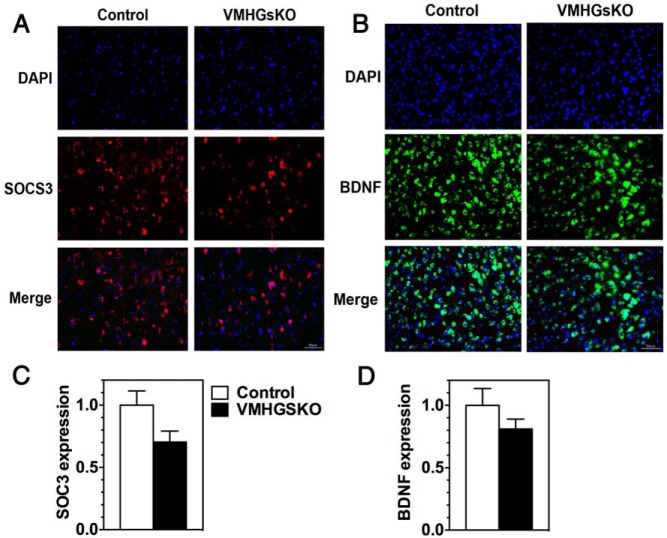
SOCS3 and BDNF expression in VMH of male control and VMHGsKO mice maintained on a HFD. A, Representative images of VMH showing 4′,6′-diamidino-2-phenylindole (DAPI) staining (top panels), SOCS3 staining (middle panels), and merged images (lower panels) from control and VMHGsKO mice maintained on 5 months of a HFD. Scale bar, 50 μm. B, Representative images of VMH showing DAPI staining (top panels), BDNF staining (middle panels), and merged images (lower panels) from control and VMHGsKO mice maintained on 5 months of a HFD. Scale bar, 50 μm. C and D, Quantification of SOCS3 (C) and BDNF (D) expression in VMH of control and VMHGsKO mice on HFD (n = 4/group).

