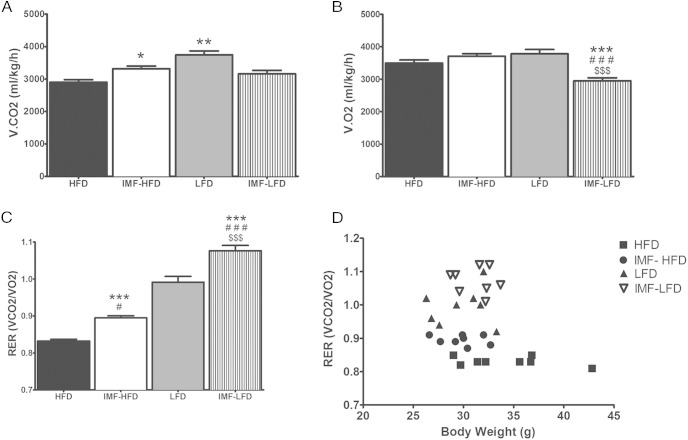
Figure 3.
RER measured by indirect calorimetry (24 h; fed day) in all groups at the end of 4 weeks of the diet intervention. Data are represented as means ± SEM. A, v.CO2. B, v.O2 C, RER. D, RER data as a function of body weight. *, Difference (P < .05) from HFD; **, difference (P < .01) from HFD; #, difference (P < .05) from LFD; ###, difference (P < .001) from LFD; $$$, difference (P < .001) from IMF-HFD.

