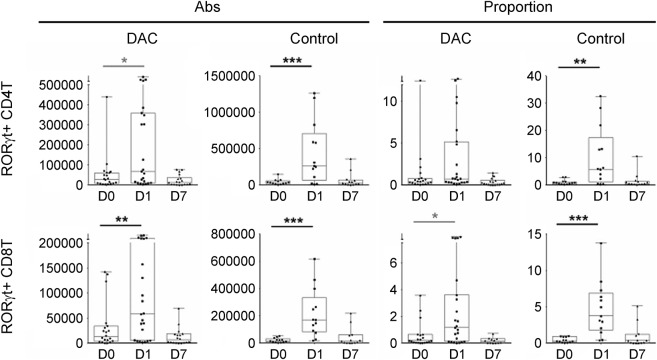
Figure 3. Flu immunization–induced changes in the proportions and absolute numbers of RORγt-expressing CD4+ and CD8+ T cells.
Expression of RORγt, the master regulator of Th17 lineage was assessed in CD4+ and CD8+ T cells by intracellular staining before (D0) and 1 day (D1) and 7 days (D7) postimmunization with Afluria 2013 vaccine. The 2 left panels in each row represent absolute numbers of identified cell populations in the daclizumab-treated patients and controls, while the 2 right panels represent proportions of the same cell populations in the identical cohorts. The vertical box plots show the median and 25%–75% range, while the whiskers reflect minimum and maximum values for each diagnostic group. The scatter dot plots correspond to individual patient's data. *p < 0.05, **0.001 < p < 0.05, ***p < 0.001. Note the differences in scales between the daclizumab and control cohorts. Abs = antibodies; DAC = daclizumab.

