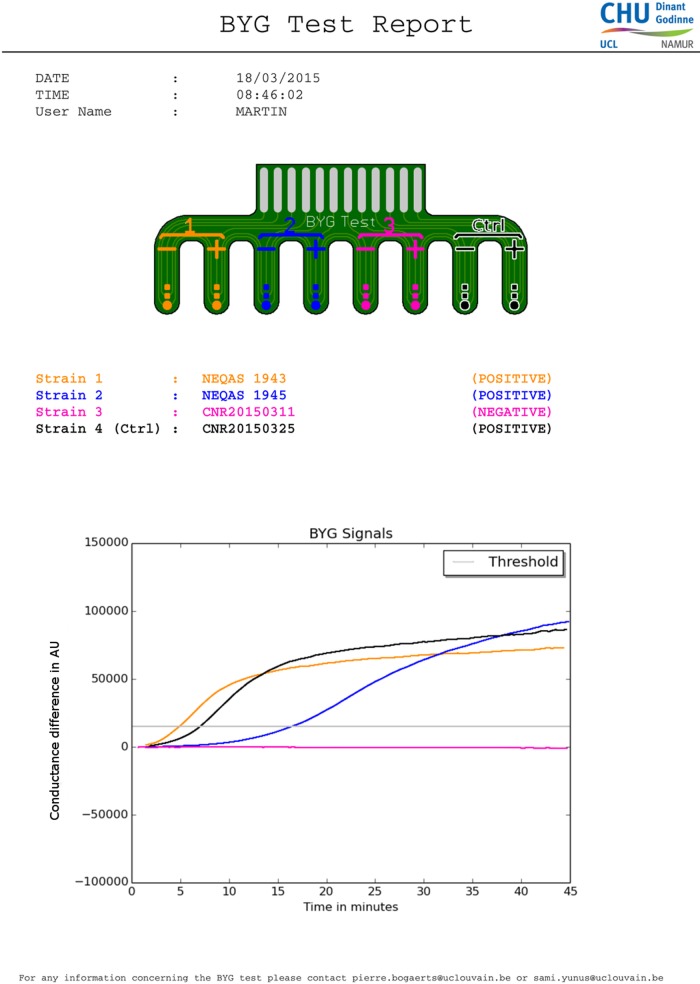
FIG 2.
Real-time curve obtained with the BYG Carba test. A report of the results automatically generated by the software is shown. The gray horizontal line represents the cutoff line. The colored lines represent the real-time curve generated during the analysis. The orange (K. pneumoniae OXA-48 NEQAS 1943), blue (K. pneumoniae VIM-1 NEQAS 1945), and black (K. pneumoniae OXA-48 control strain CNR20150325) curves correspond to positive strains, and the pink flat curve corresponds to a negative Enterobacter aerogenes strain (CNR 20150311). The y axis is linked to the conductance of polyaniline, and values are expressed in arbitrary units.

