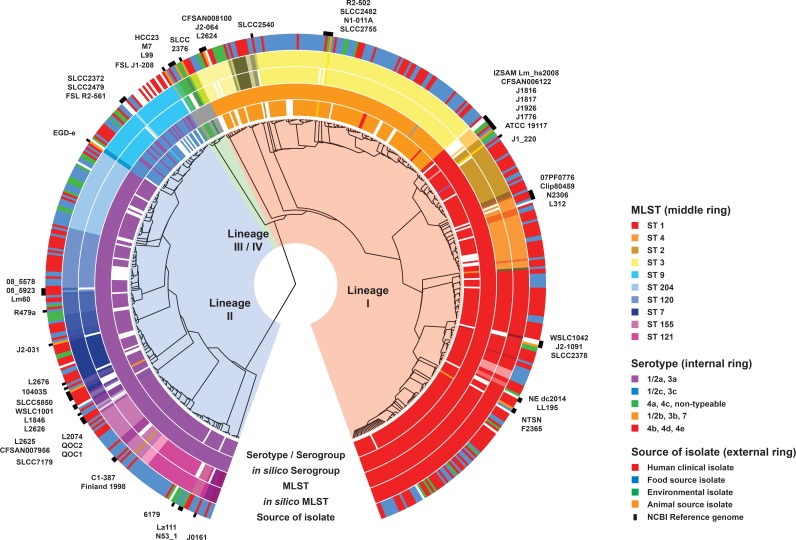
FIG 1.
Maximum-likelihood phylogeny of Australian L. monocytogenes isolates. Isolates from human, food, and environmental sources are shown and include comparisons between three evolutionary lineages, serotypes, and MLSTs. The source of the isolate is indicated in the outer ring by the colors in the legend. The inner rings show serotype and MLST groupings, with the same color representing the same serotype or MLST in their respective rings. The most prominent MLST types are shown in the legend. Colors have been grouped to reflect lineage associations—lineage I (red, orange, yellow), lineage II (pink, purple, blue), and lineage III/IV (green). Similar colors (e.g., bright red and light red) also reflect closely related MLSTs that differ by a single allele, i.e., same clonal complex. The reference genomes listed in Table S3 in the supplemental material have been included for context. The phylogeny was inferred using FastTree v2.1.8 from the pairwise alignment of 158,707 core genome SNPs using the reference genome F2365 (BioSample accession no. SAMN02603980). The alignment was constructed using Snippy v2.5, and the figure was constructed using GraPhlAn v0.9.7 (https://huttenhower.sph.harvard.edu/graphlan).

