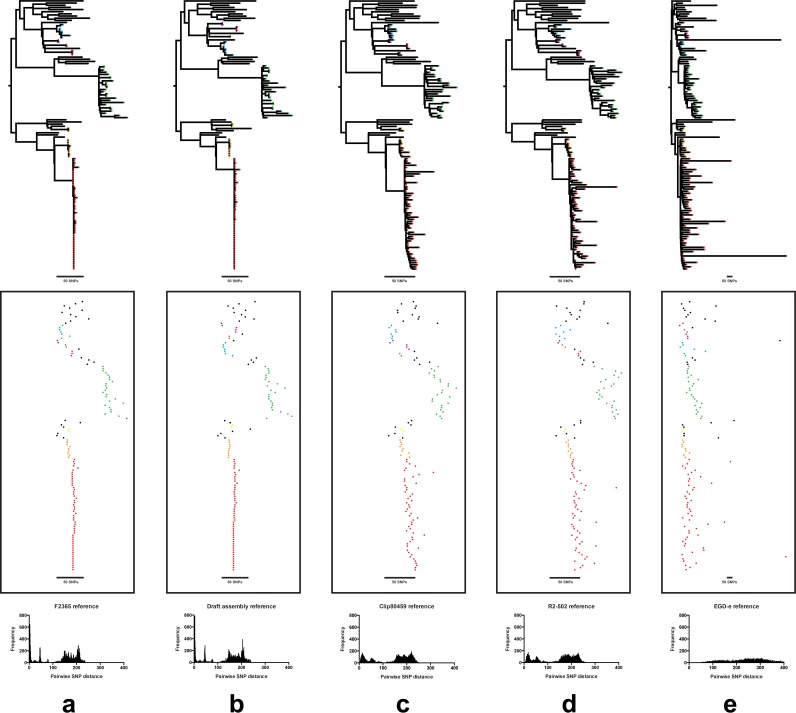
FIG 3.
Comparison of the pairwise core genome SNP distances and resulting phylogeny for clonal complex 1 isolates when mapping to different reference genomes. The panels show the phylogeny (top), clusters of isolates (middle), and pairwise SNP distributions (bottom) when using (a) a closely related closed reference genome of the same MLST (F2365; BioSample accession no. SAMN02603980), (b) a local de novo assembled draft reference genome from the data set, (c) a closed reference genome of the same serotype, but different MLST (Clip 80459; BioSample accession no. SAMEA2272134), (d) a closed reference genome of the same lineage but different serotype and MLST (R2-502; BioSample accession no. SAMN02203126), and e) a closed reference genome from a different ancestral lineage (EGDe; Bio Sample accession no. SAMEA3138329). In the middle panel, the tips of the phylogenetic tree have been colored by cluster, with the branches obscured by the background.

