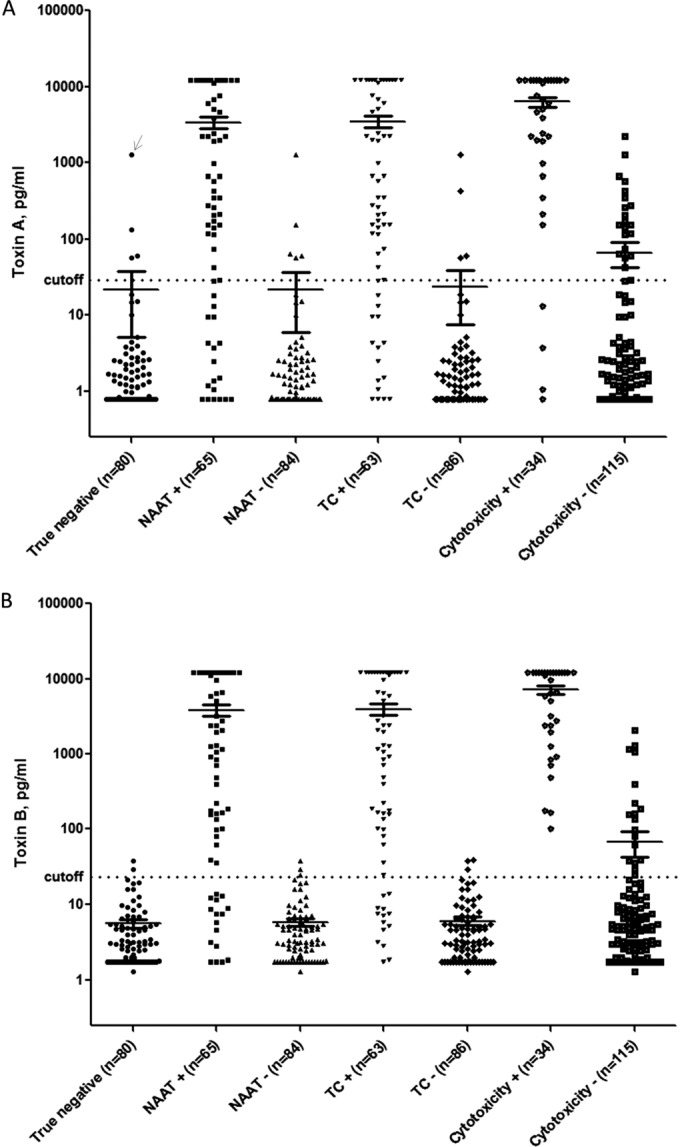
FIG 1.

Toxin A and B digital ELISA results (39). Toxin A and B digital ELISA results for groups of samples testing positive versus negative on other assays (i.e., NAAT+ versus NAAT−, TC+ versus TC−, and cytotoxicity+ versus cytotoxicity−) are shown in Fig. 1A and B, respectively. Mean signals in each group are indicated by horizontal lines. The calculated clinical cutoffs for each digital ELISA (29.4 pg/ml for the toxin A assay and 23.3 pg/ml for the toxin B assay) are shown as dotted lines spanning each panel. The arrow in Fig. 1A indicates a sample that was excluded from calculation of the cutoff because it was an extreme outlier and substantially distorted the mean for that assay. NAAT, nucleic acid amplification testing; TC, toxigenic culture. (Reprinted from reference 39.)
