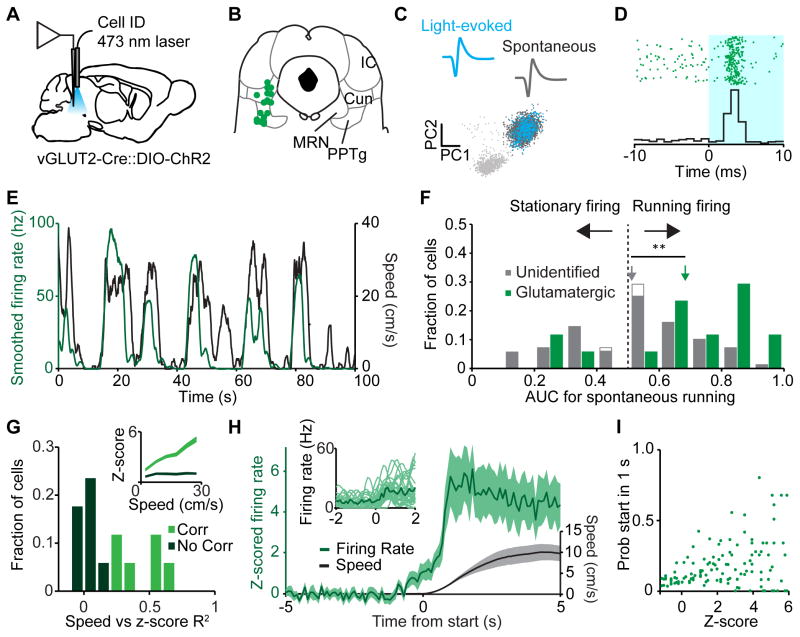
Figure 3. Characterization of MLR glutamatergic neurons.
(A) Schematic of optical tagging and recording setup in vGLUT2-Cre::DIO-ChR2 mice. (B) Recording sites for ChR2-positive (glutamatergic) neurons. (C) Top, light-evoked and spontaneous waveforms of an identified neuron. Bottom, PC1 vs PC2 for the neuron. Light gray dots, noise; dark gray dots, spontaneous spikes; blue dots, light-evoked spikes. (D) Raster (top) and PSTH (bottom) for a light-reactive neuron showing 3 ms latency aligned to laser onset. (E) Smoothed firing rate of the neuron identified in (C) and (D) (green line, left axis) plotted with the speed of the mouse (black line, right axis). (F) Histogram of AUC’s for all recorded neurons during spontaneous locomotion. Green bars, identified glutamatergic neurons (all significantly encoded the stationary or locomotor state); filled grey bars, unidentified neurons recorded in the MLR from a separate cohort that significantly encoded the stationary or running state; open grey bars represent neurons which did not significantly encode either state. Arrows, means; ** p < 0.001, Wilcoxon rank sum. (G) Histogram of R2 values for the glutamatergic neurons that predicted locomotion in (F) (n = 14). Light green bars, speed correlated neurons; dark green bars, neurons not correlated with speed. (H) Population z-scored firing rate of identified glutamatergic neurons (green trace) aligned to onset of locomotion. Black trace, speed. Inset, individual example firing rate traces (light green) and average (dark green) aligned to starts. (I) Probability of a start within one second given z-scored firing rate. Each point represents one binned data point (0.1 sd bins) from one neuron. All shaded regions, s.e.m. See also Figure S3.

