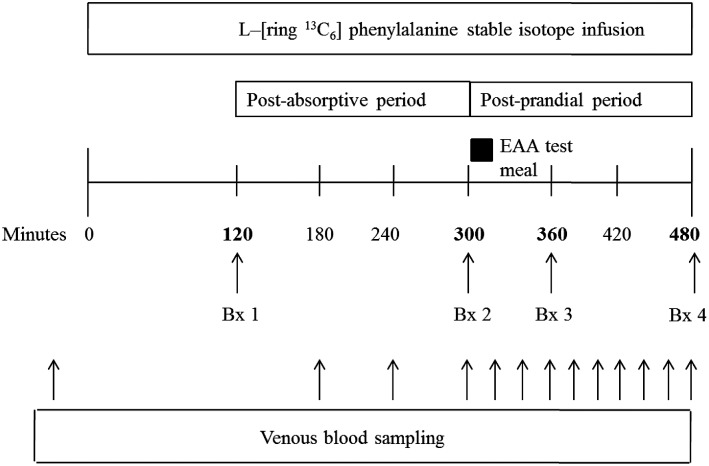
FIGURE 2.
Metabolic study timeline. Postabsorptive and postprandial cell signaling were determined from biopsy samples 1 and 3, respectively. Postabsorptive FSR was calculated by using biopsy samples 1 and 2; FSR in the postprandial state was determined by using biopsy samples 2 and 4. Control group, n = 9; leucine-supplemented group, n = 10. Bx, muscle biopsy; EAA, essential amino acid; FSR, fractional synthesis rate.

