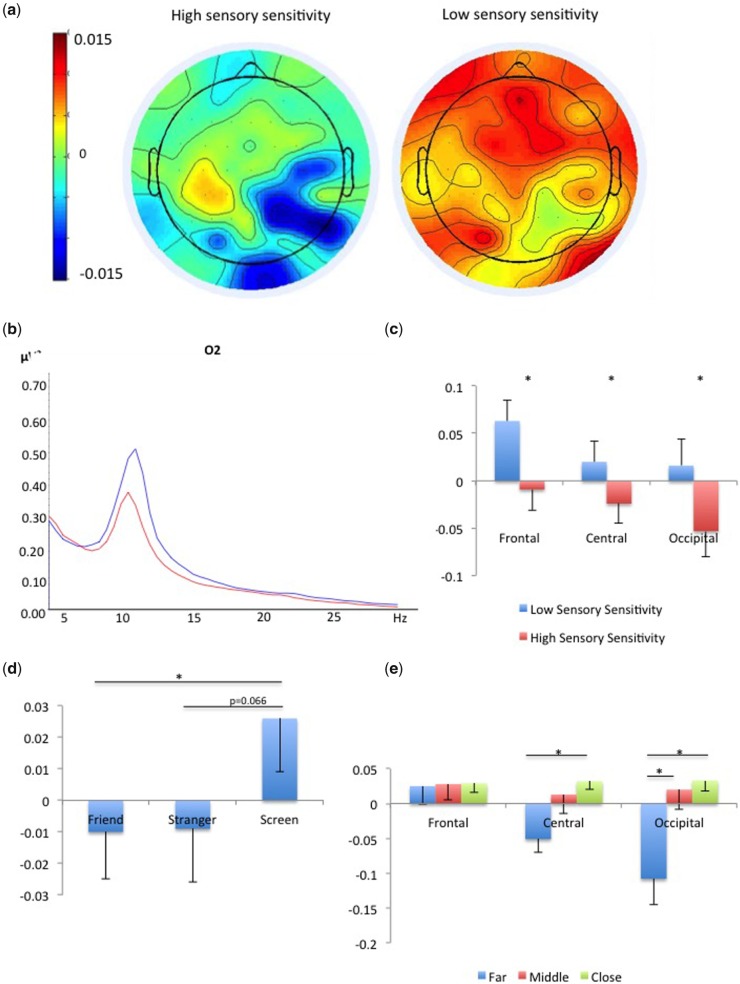
Fig. 4.
EEG results: (a) Alpha suppression was greater for the high sensory sensitivity group than for the low sensory sensitivity group; (b) Power in 5–30 Hz averaged across all conditions for low (red) and high (blue) sensory sensitivity groups in electrode O2; (c) Alpha suppression compared with fixation (baseline) in high and low sensory sensitivity groups, in frontal, central and occipital sites. Error bars depict standard error and asterisks depict significant results (P < 0.05). (d) Alpha suppression was greater for the human figures compared with the computer screen; (e) Alpha suppression was greater for the farthest distance, which was the first appearance of the figure approaching, significant in the occipital and central sites. In both figures error bars depict standard error and asterisks depict significant results (P < 0.05).

