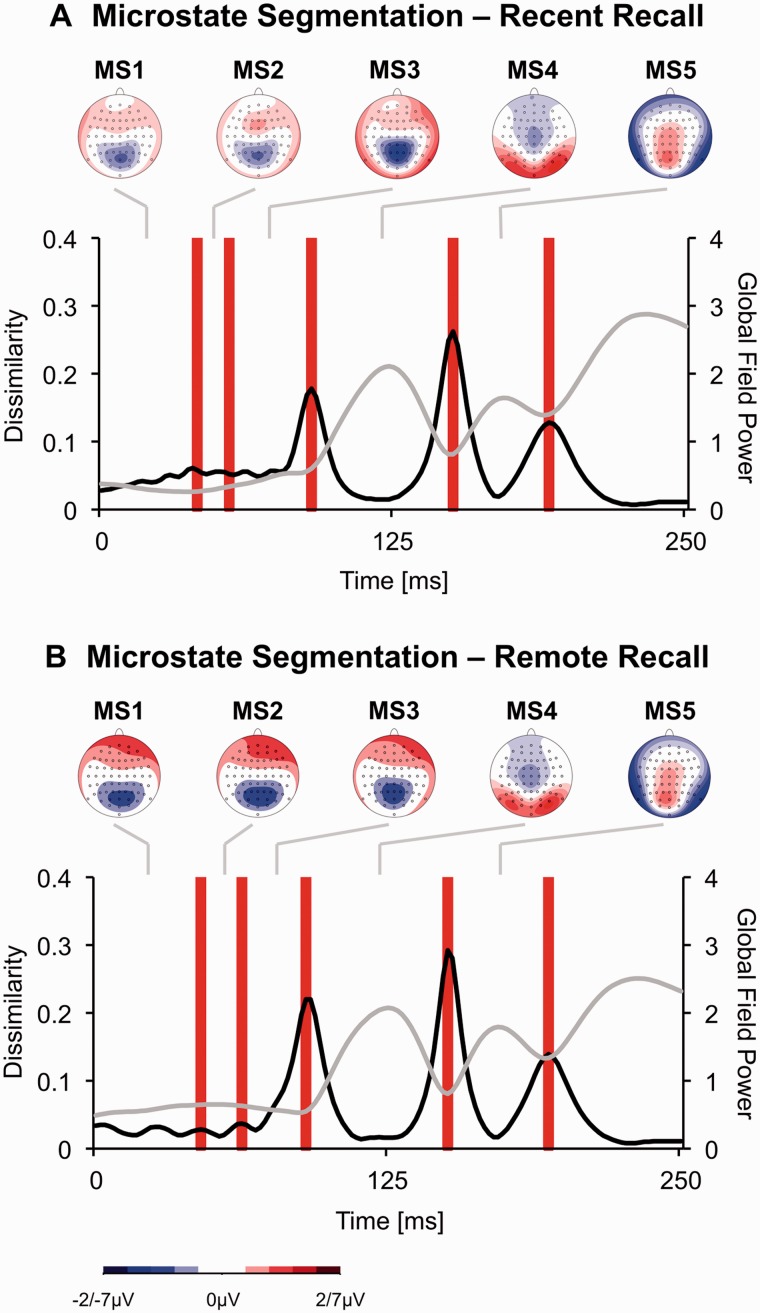
Fig. 2.
(A) Microstate segmentation of the grand average event-related potential evoked by CS (averaged across the 2 × 2 CS types) during the Recent Recall Test. The black line (for values see primary x-axis) represents the global dissimilarity, whereas the gray line represents the global field power (for values see secondary x-axis). Red bars indicate microstate borders as identified with global dissimilarity peaks. The topography of the voltage distribution for each microstate is also shown. Note that in order to avoid saturation, topography plots for microstates 1, 2 and 3 range from −2 to 2 µV whereas topography plots for microstates 4 and 5 range from −7 to 7 µV. (B) Microstate segmentation of the grand average event-related potential evoked by CS (averaged across the 2 × 2 CS types) during the Remote Recall Test.

